GeoMetrikks tails your reverse proxy's access log, looks every request up in GeoLite2, and draws it on a world map within seconds. Traffic analytics, a searchable history, and CrowdSec bans next to the traffic that caused them. On your own hardware.
Sources
The format is detected per file. Rotated files are followed. Archives, plain or gzipped, can be backfilled through the same pipeline with one command.
geometrikks-jsonnginxcombinedlog_format geometrikks_json escape=json
'{'
'"client_ip":"$remote_addr",'
'"timestamp":"$time_iso8601",'
'"method":"$request_method",'
'"path":"$request_uri",'
'"protocol":"$server_protocol",'
'"status":"$status",'
'"bytes":"$body_bytes_sent",'
'"host":"$host",'
'"referrer":"$http_referer",'
'"user_agent":"$http_user_agent",'
'"remote_user":"$remote_user",'
'"request_time":"$request_time",'
'"upstream_time":"$upstream_response_time",'
'"request_raw":"$request"'
'}';
access_log /config/log/nginx/access.log geometrikks_json;ACCESS_LOG_DIR=/var/log/nginx LOGPARSER_LOG_PATHS=/var/log/access/access.log
traefik-jsonaccessLog:
filePath: "/var/log/traefik/access.log"
format: json
fields:
headers:
names:
User-Agent: keep
Referer: keepACCESS_LOG_DIR=/var/log/traefik LOGPARSER_LOG_PATHS=/var/log/access/access.log
caddy-json(log_settings) {
log {
output file /var/log/caddy/access.log
format json
level INFO
}
log_append upstream_duration_ms {rp.upstream.duration_ms}
}
app.example.com {
import log_settings
reverse_proxy app:8000
}ACCESS_LOG_DIR=/var/log/caddy LOGPARSER_LOG_PATHS=/var/log/access/access.log
Inside GeoMetrikks
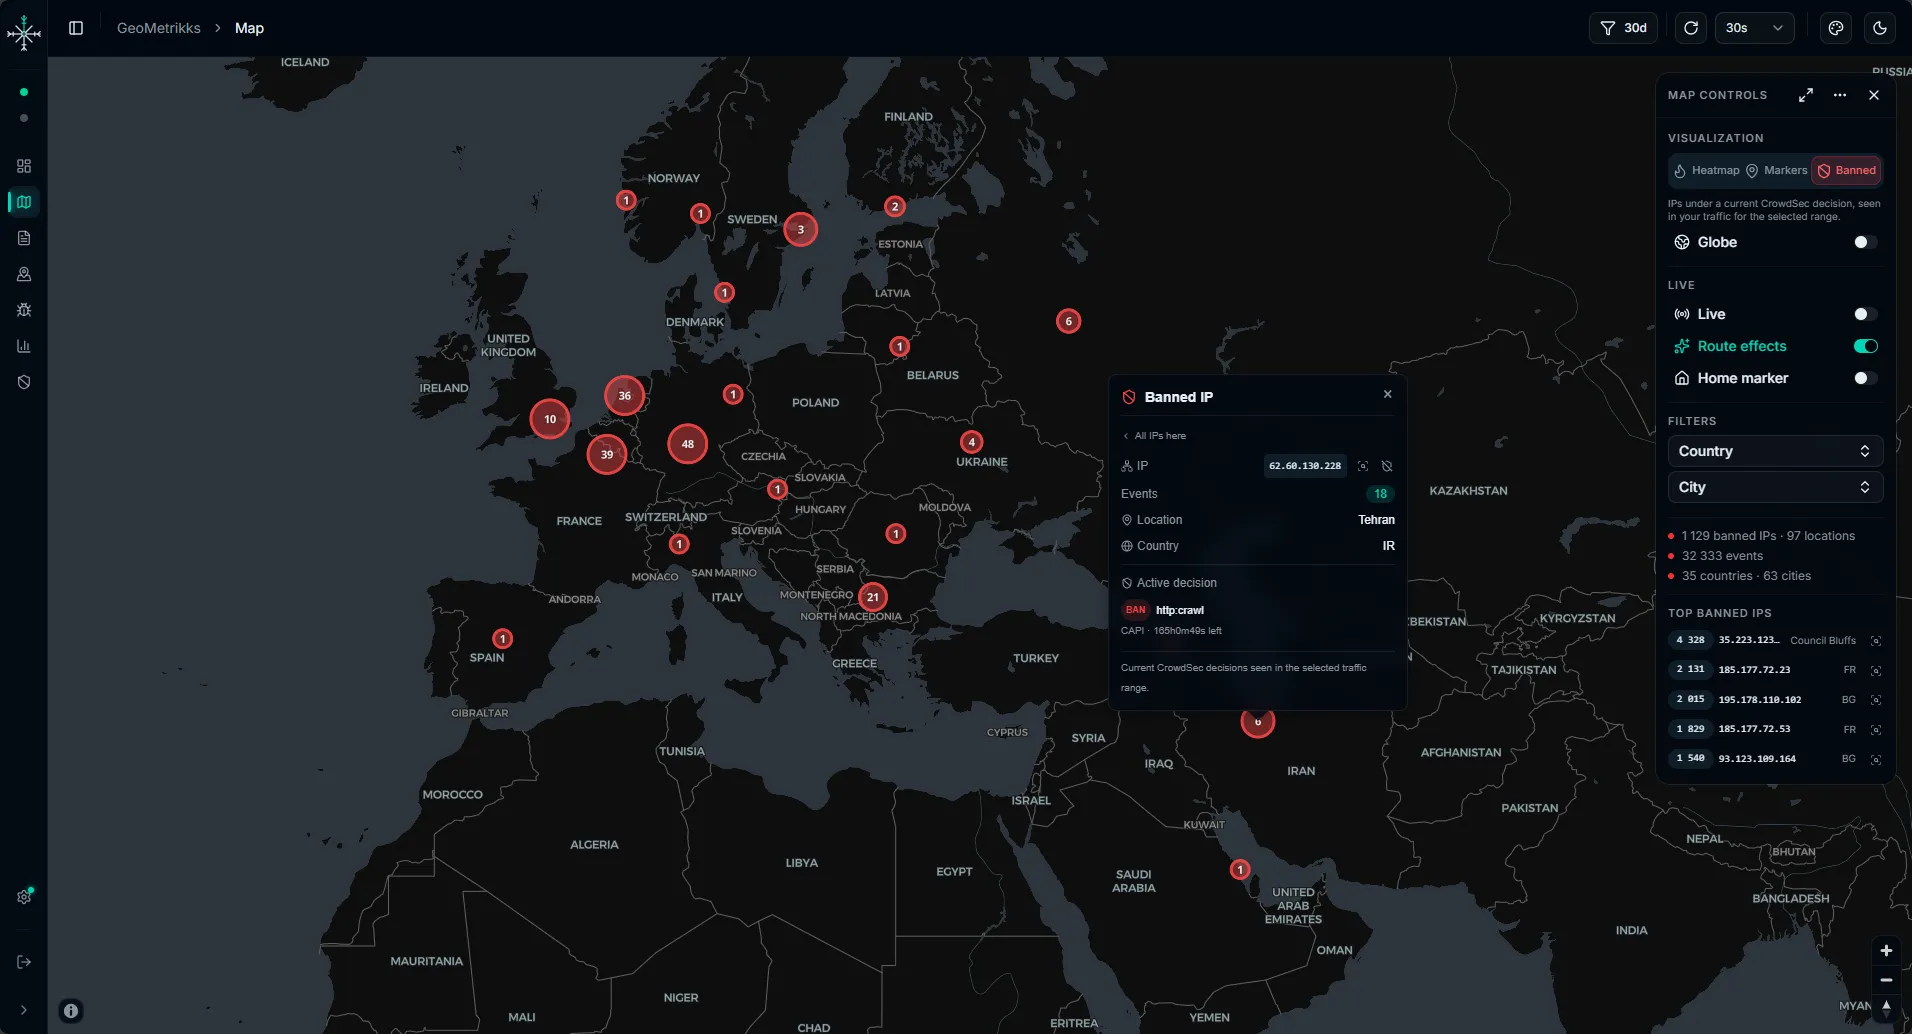
Live map. Show requests as markers, clusters or a heatmap on a flat map or globe, or switch to the Banned IPs view to see where CrowdSec bans come from. Live routes end at the server location you configure.
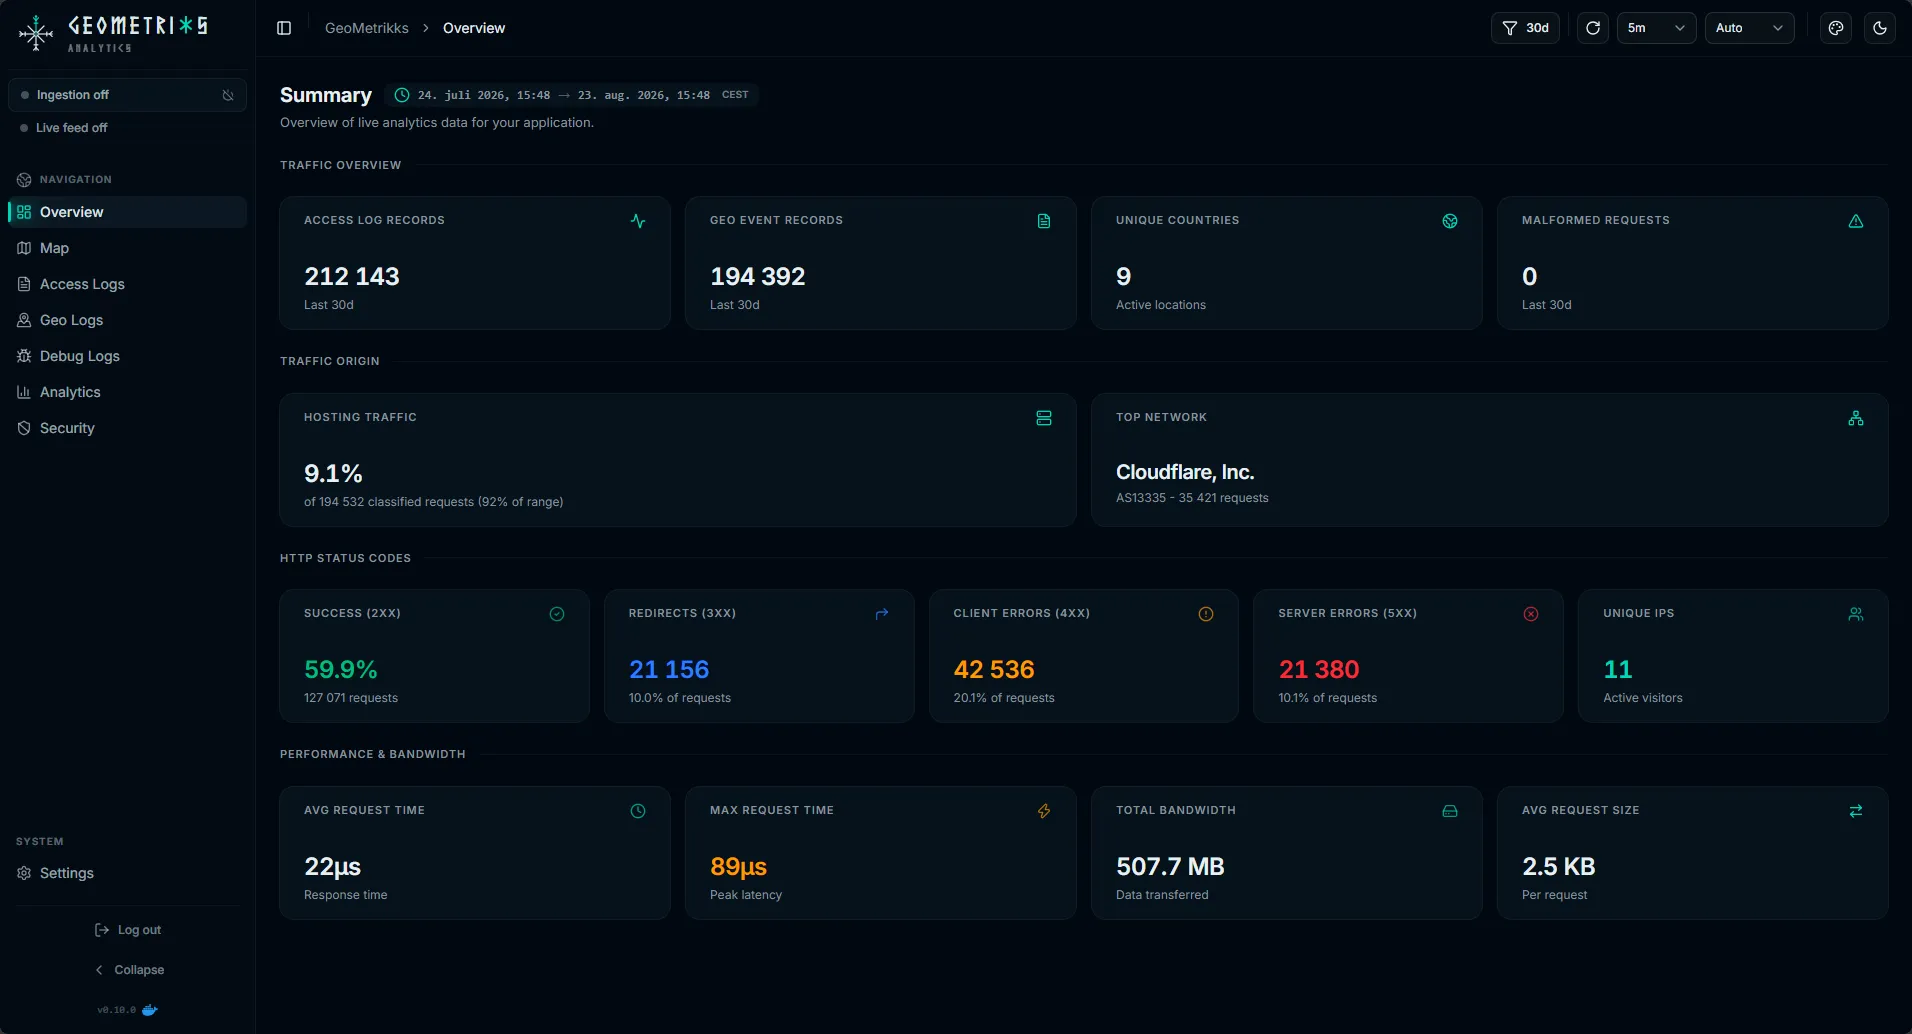
Overview. Requests, visitors, bandwidth and errors for the chosen time period, compared with the previous period.
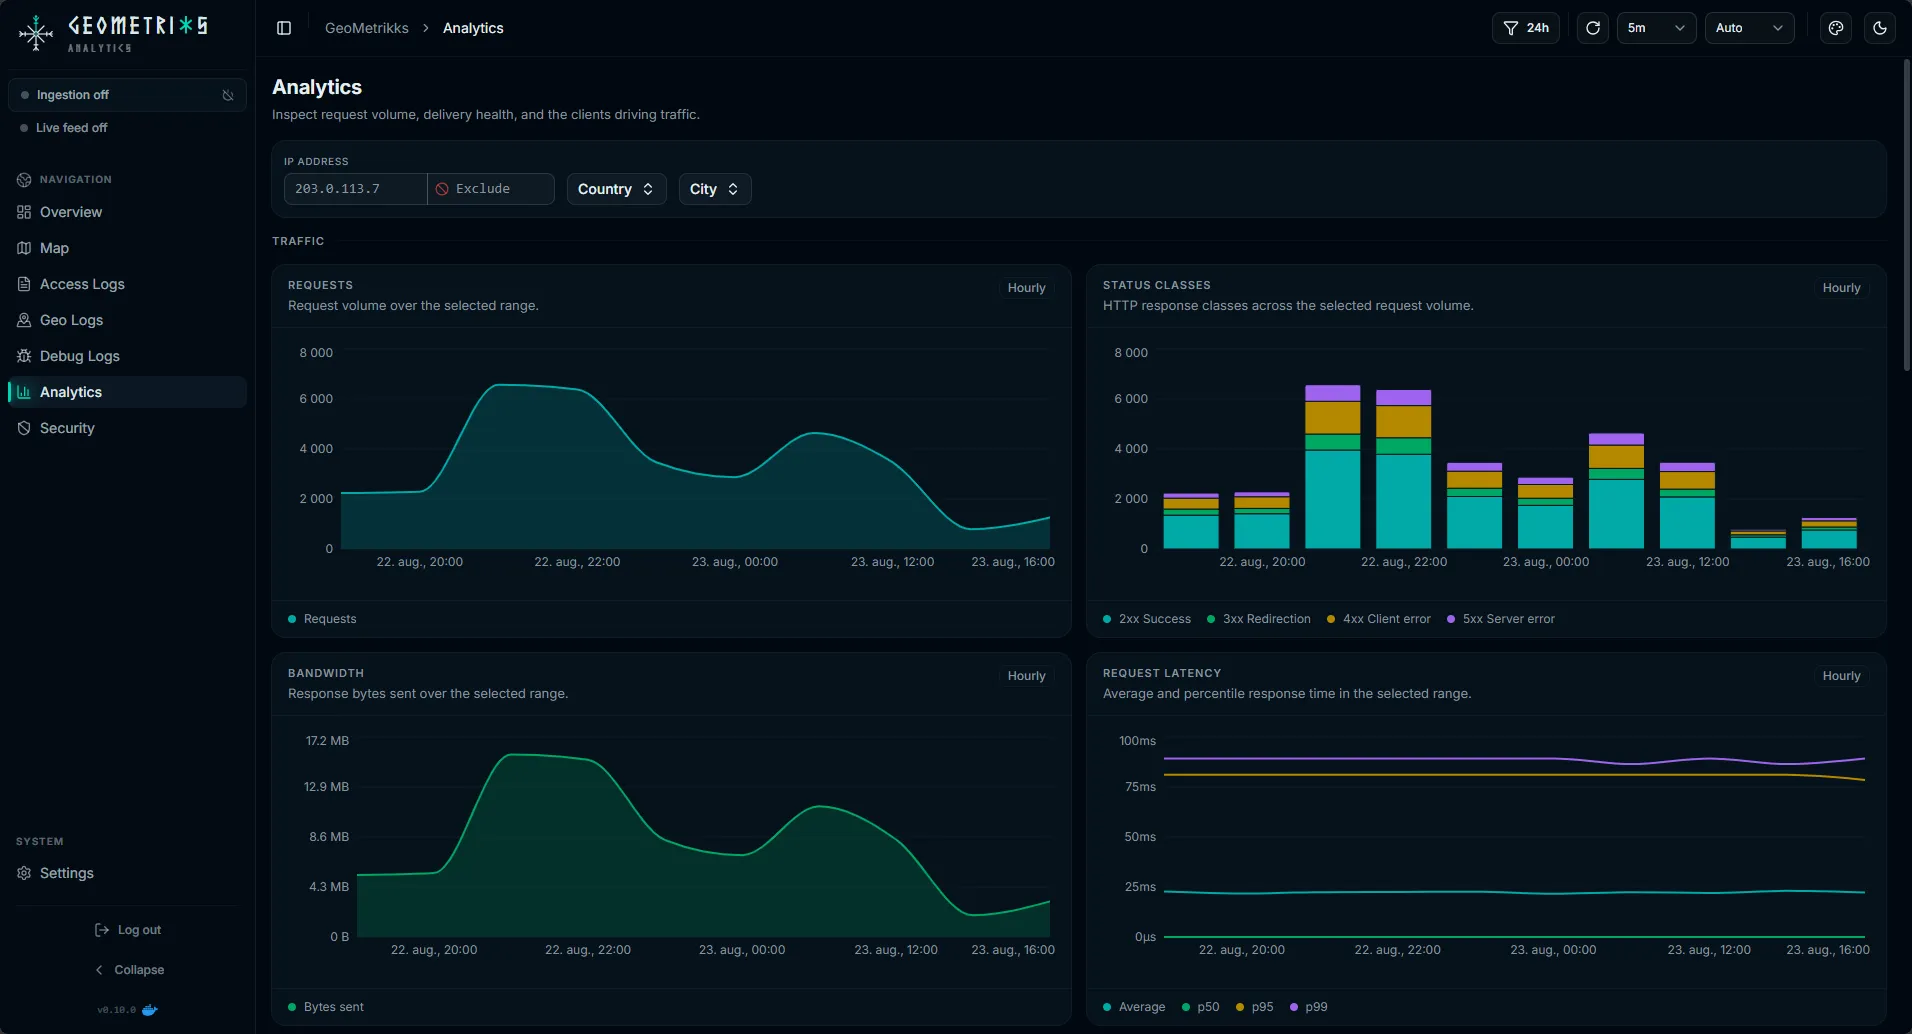
Analytics. Request volume, response codes, latency percentiles, bandwidth, top URLs by host, user agents and ASNs.
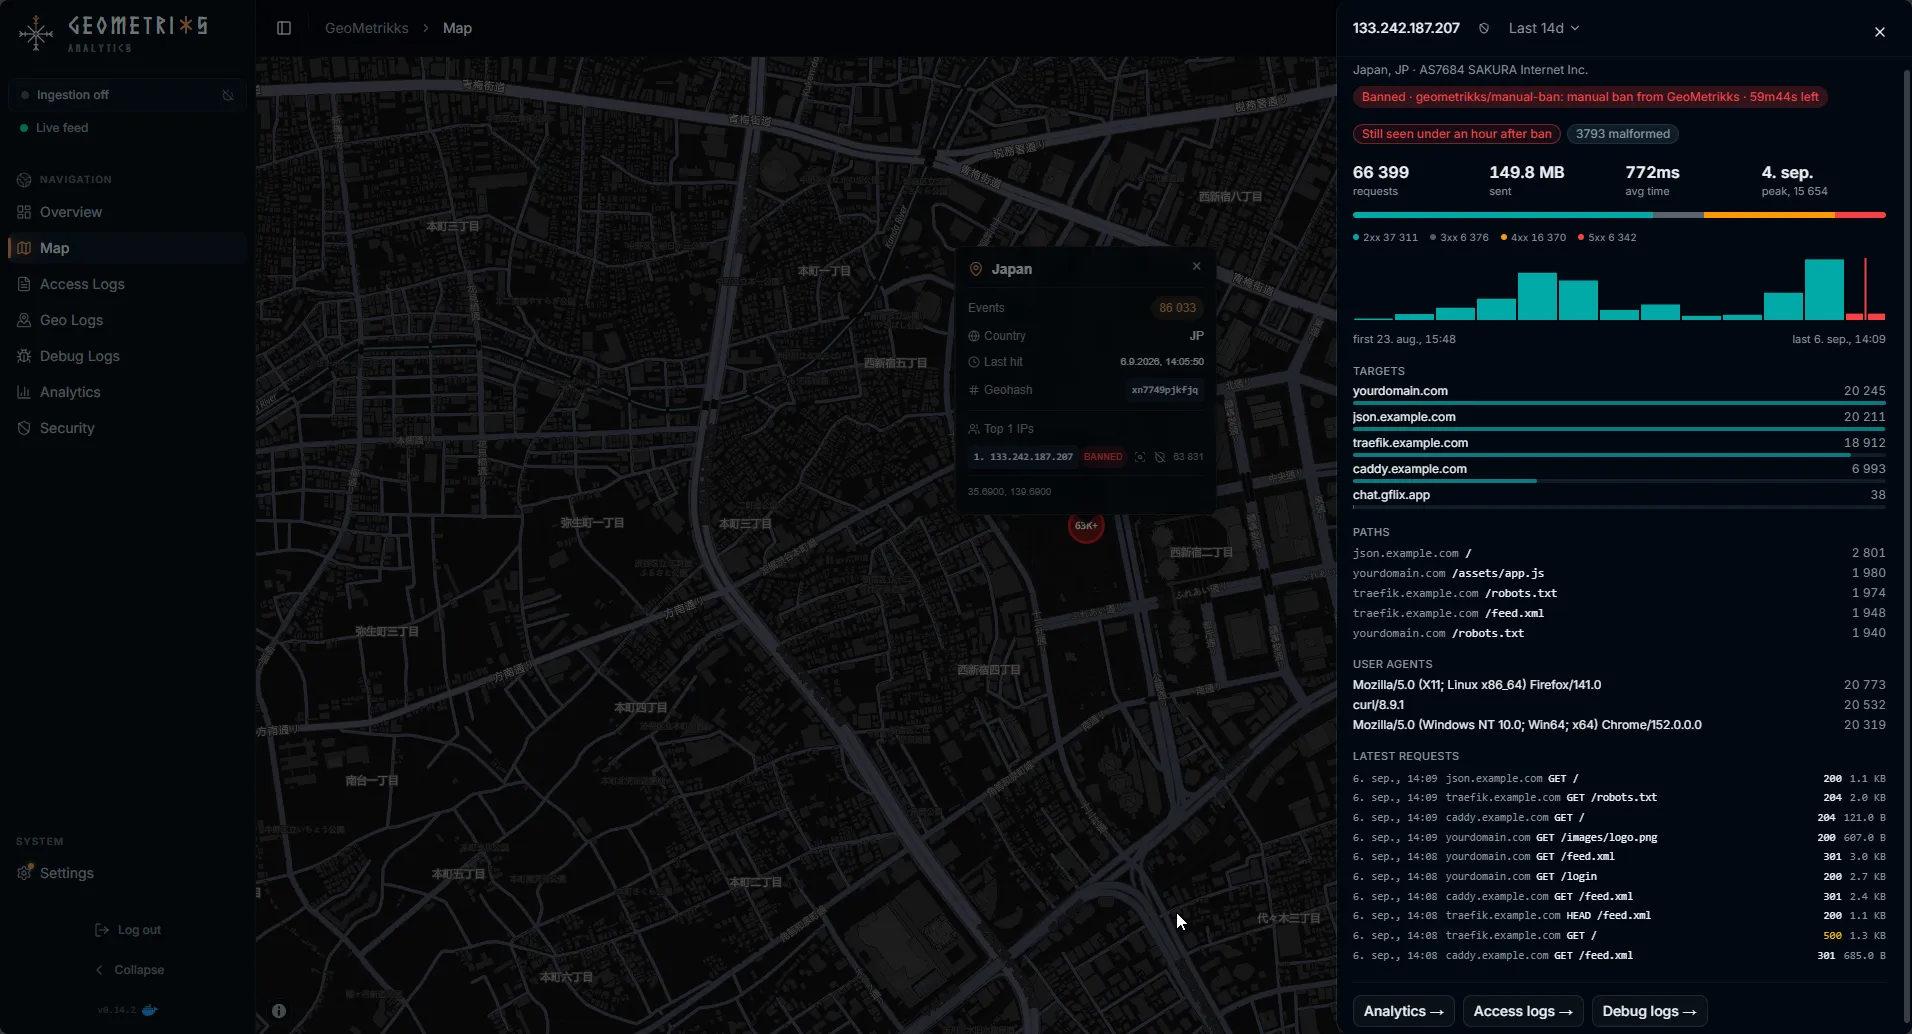
IP inspector. Select an address to see request counts, bandwidth, response codes over time, hosts, paths, user agents, recent requests and CrowdSec status. You can ban it here too.
Request details
Watch new requests arrive on the access logs page. The feed pauses while you hover so rows do not move under the cursor.
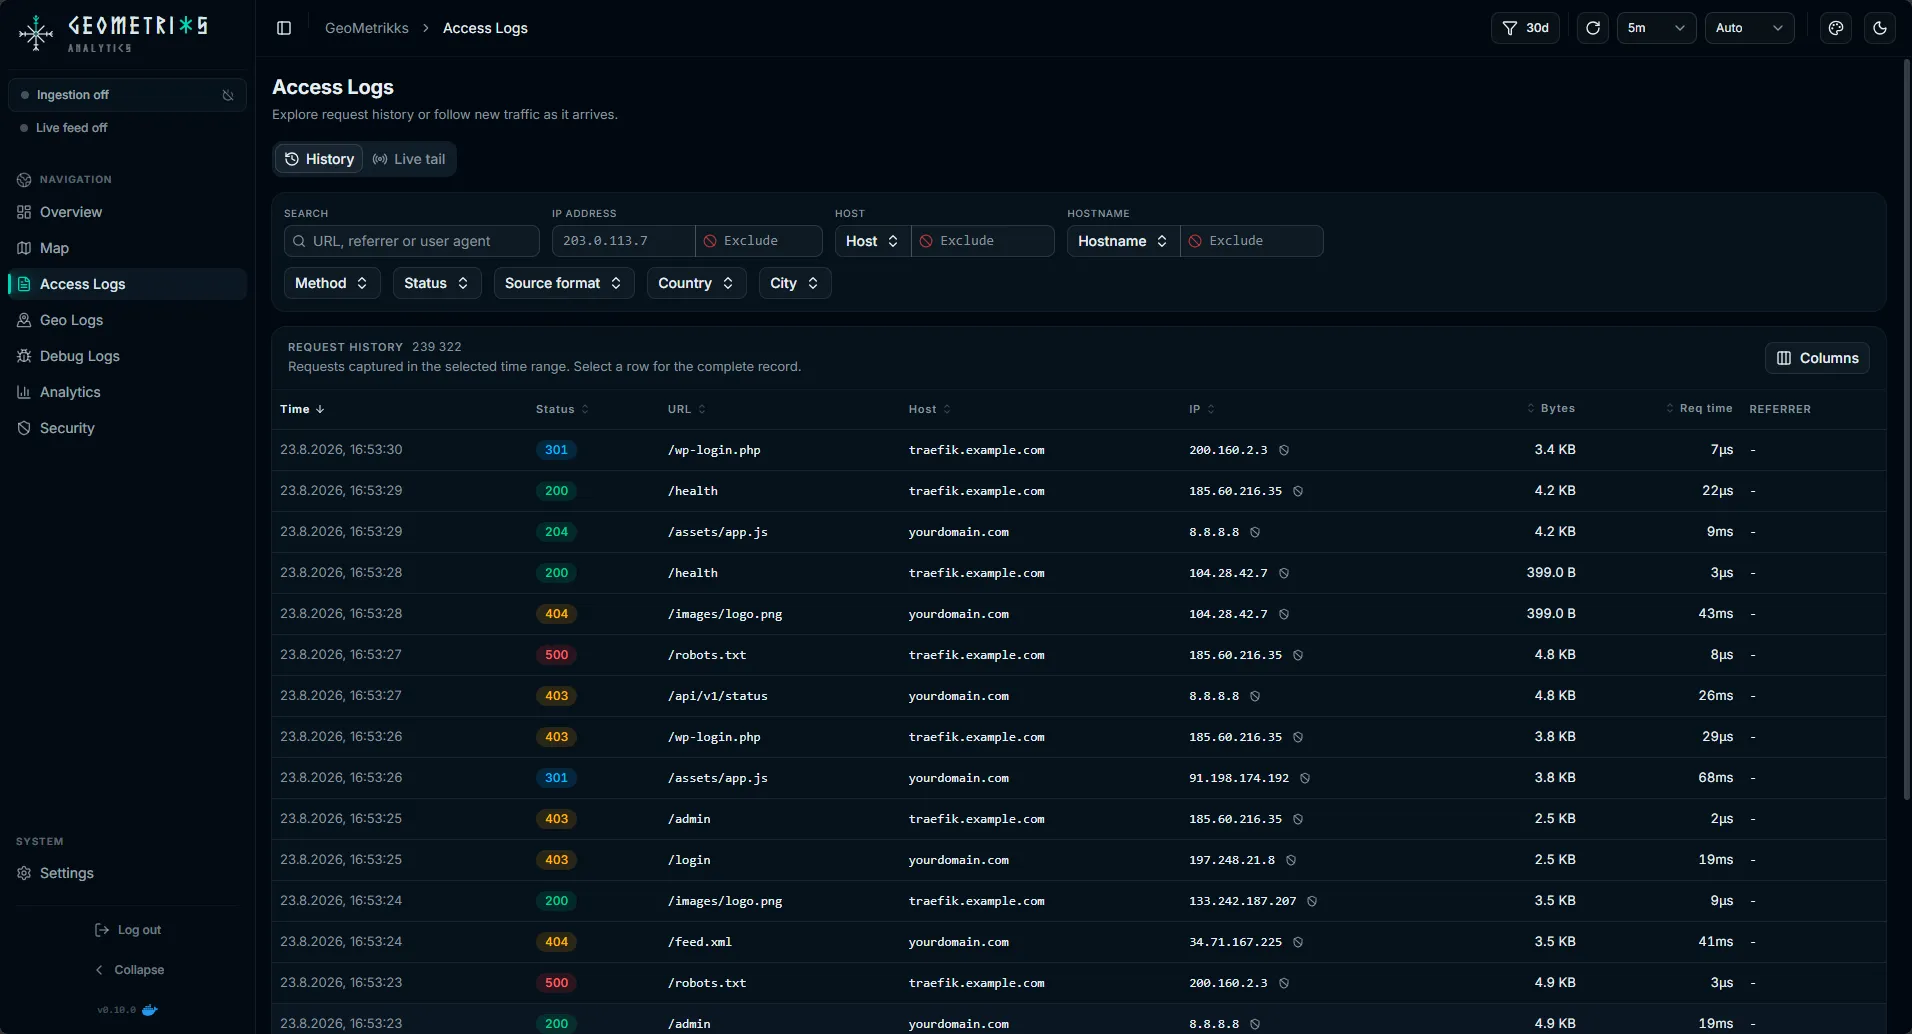
Search every request and filter by status, method, IP, host, country or source. Results are paginated on the server.
Open an address to see its request count, bandwidth, status codes, user agents, hosts and paths. Check its CrowdSec status or ban it there.
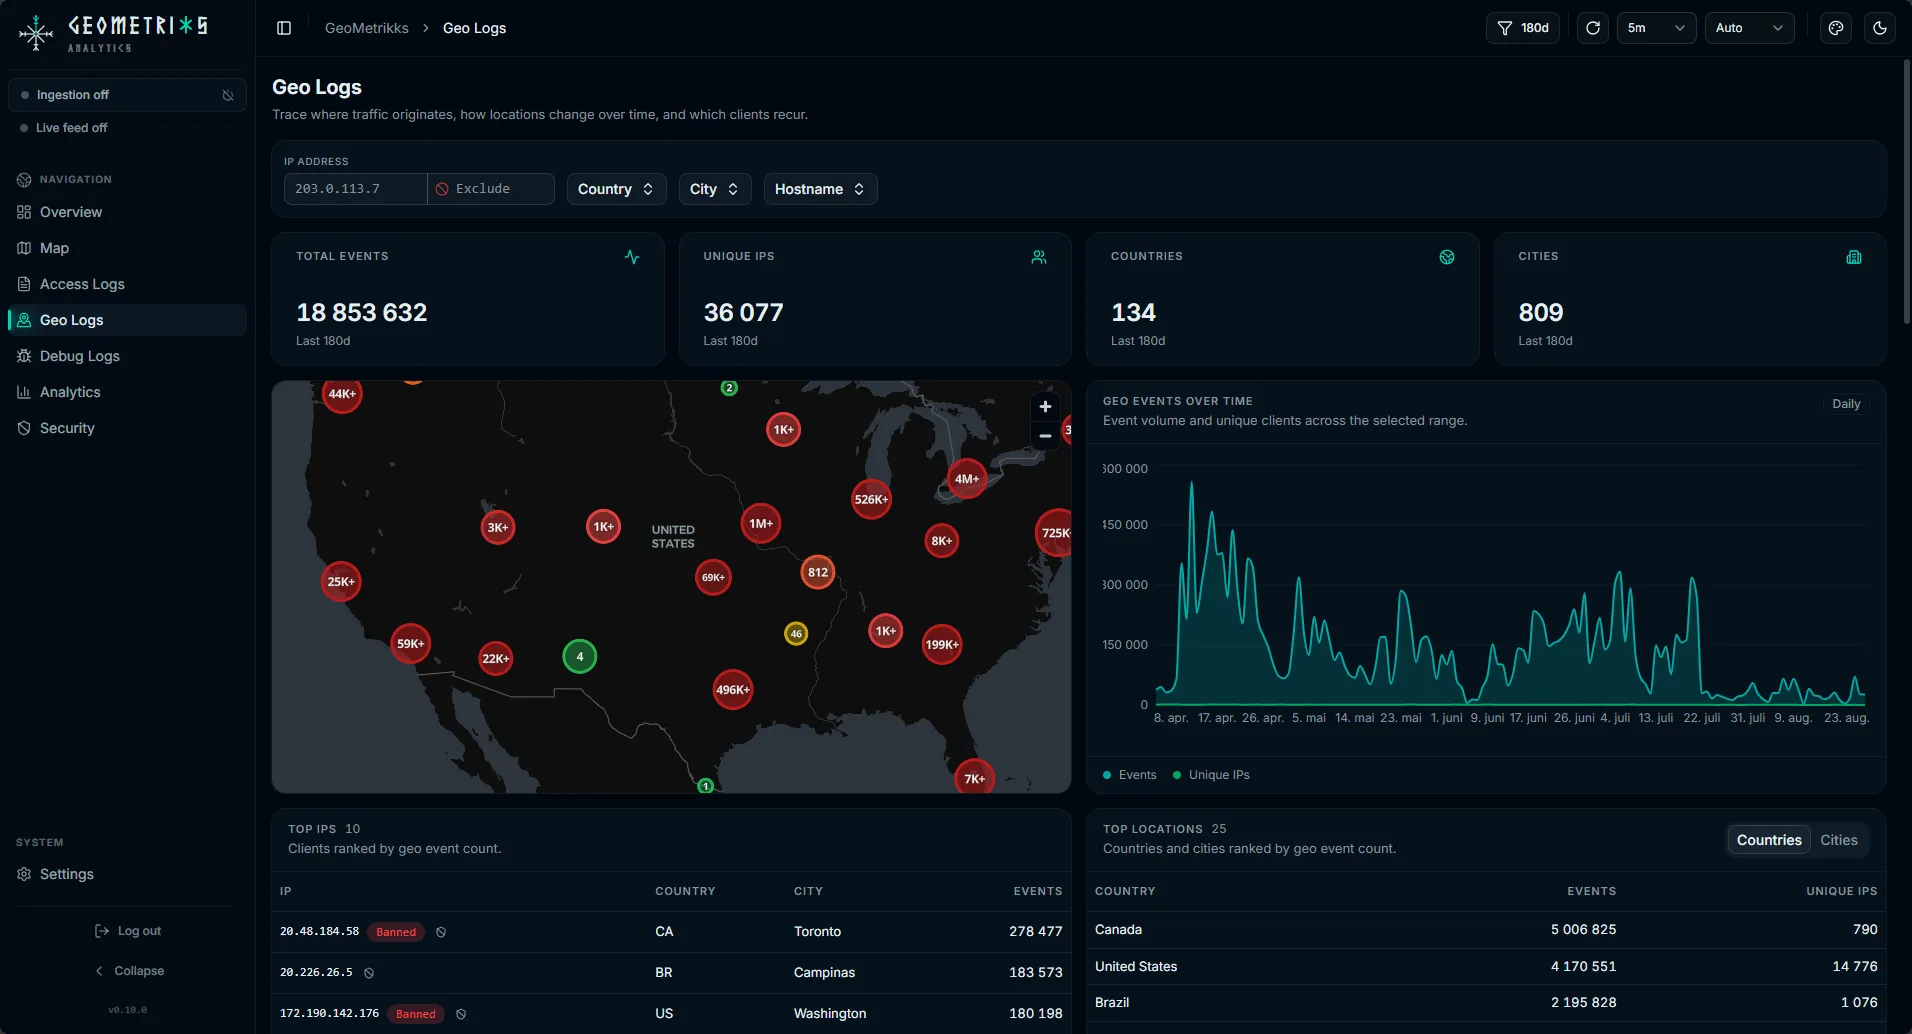
Group traffic by country and city, compare activity over time, and see the top IPs and locations for the selected range.
Import rotated or archived logs, including gzip files, with one command. Checksums prevent the same file from being imported twice.
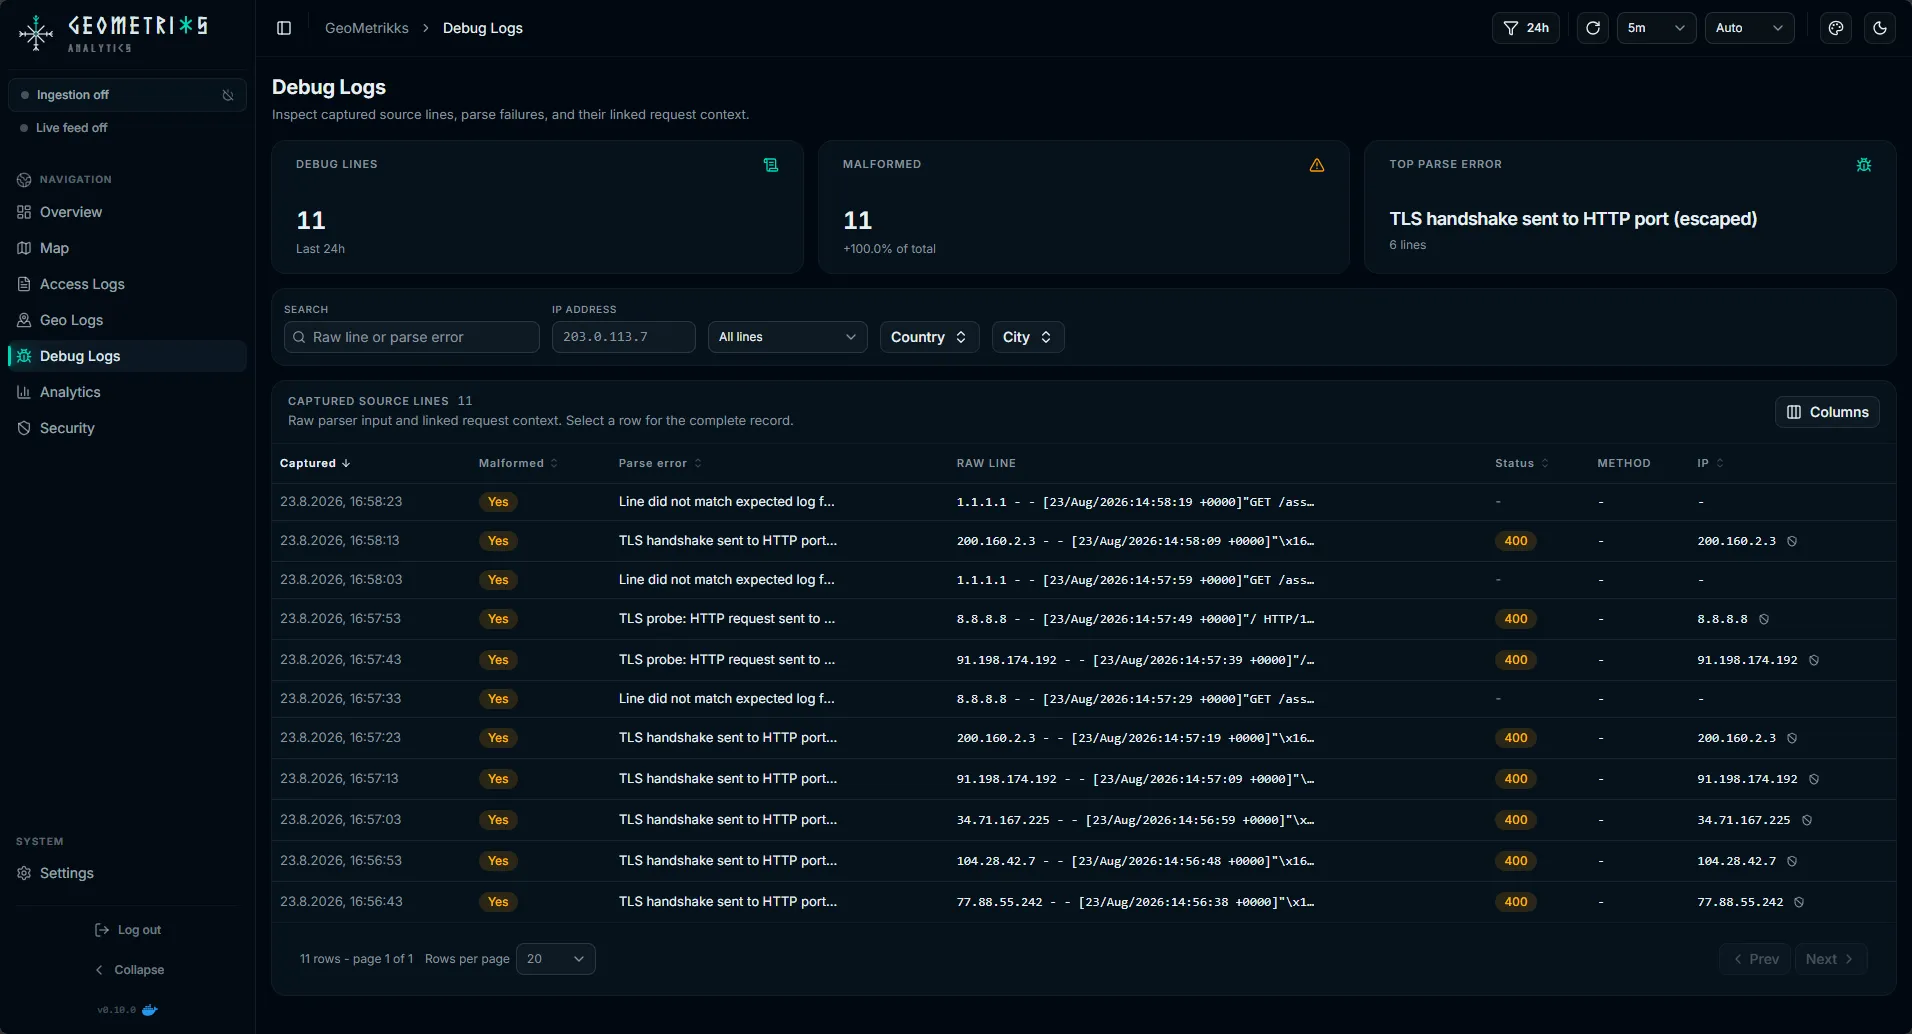
Inspect the raw line for each parsed request. Parse failures appear here too, so you can find log lines GeoMetrikks could not read.
CrowdSec
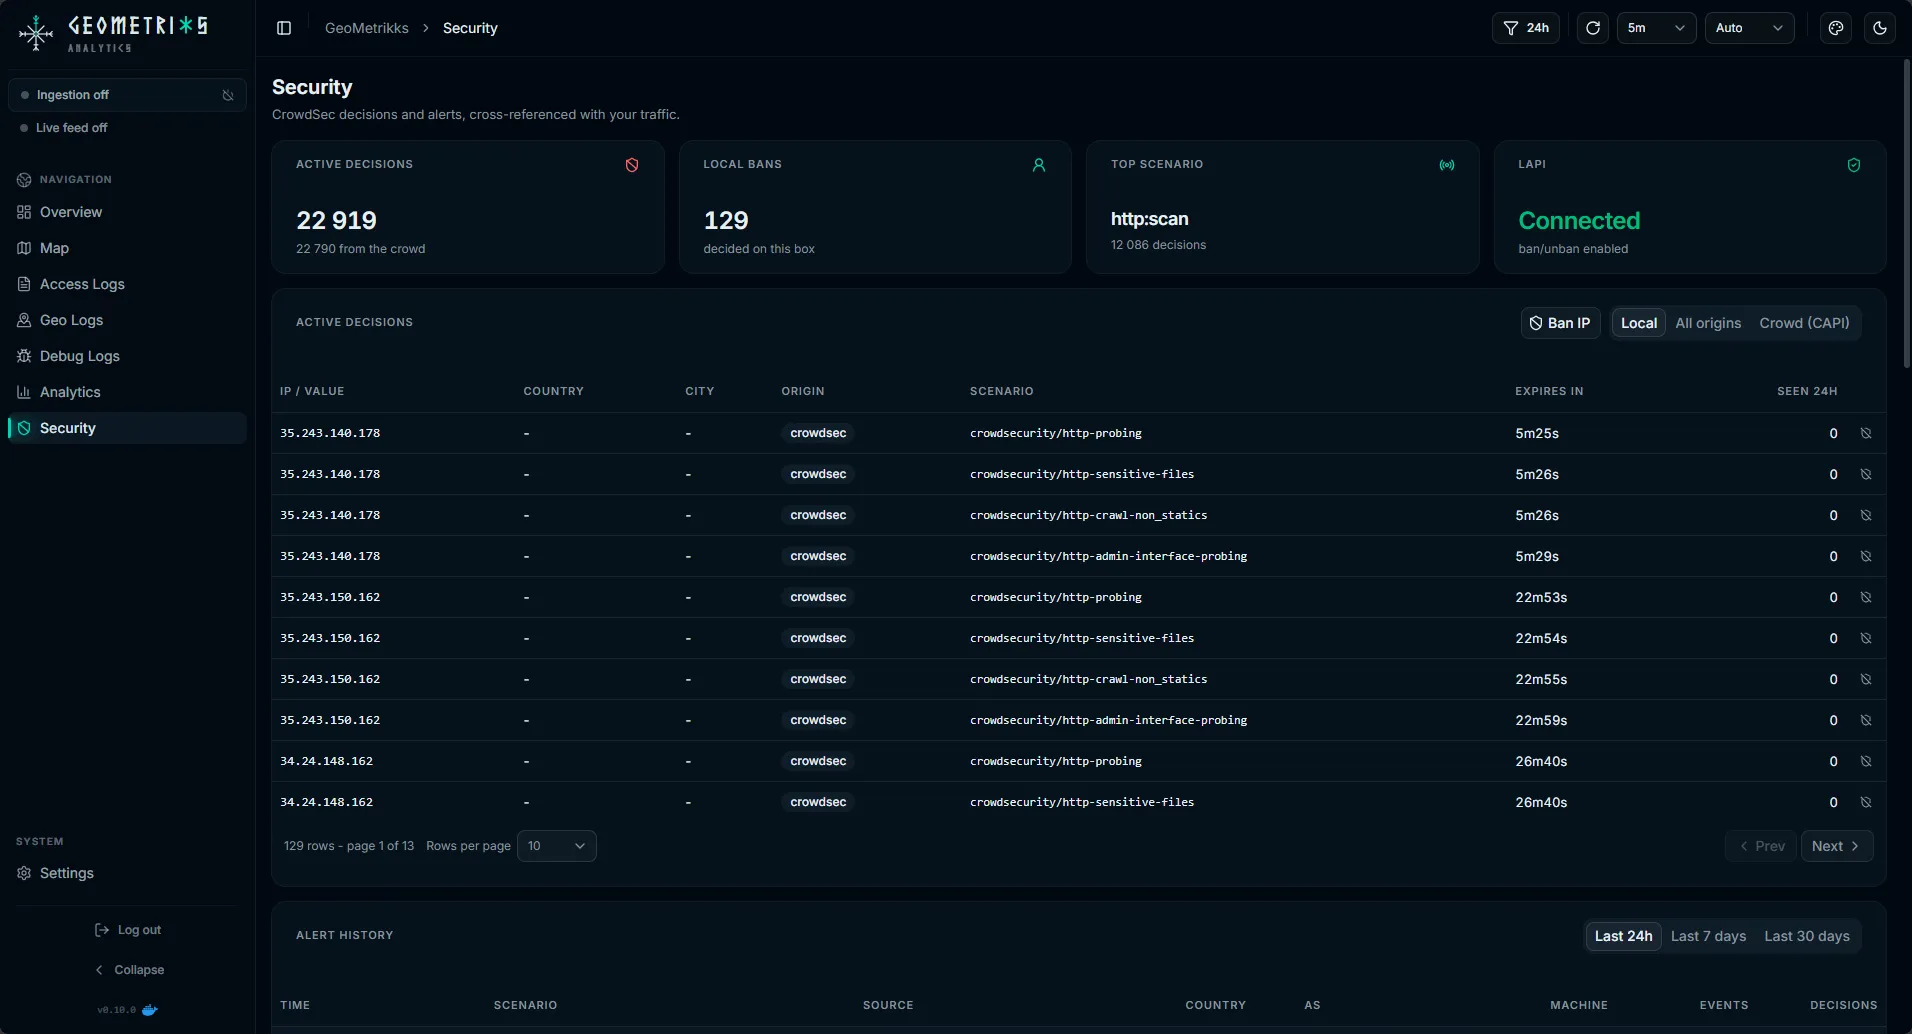
Connect the Local API and the map's Banned IPs view shows where the bans come from. Open any of them in the IP inspector to see what that address did to earn it.


# prints the API key
docker exec crowdsec cscli bouncers add geometrikks
CROWDSEC_LAPI_URL=http://crowdsec:8080
CROWDSEC_BOUNCER_API_KEY=<key>CrowdSec decides; a bouncer in front of your stack still does the blocking. GeoMetrikks shows and manages decisions, it does not block traffic. CrowdSec setup in the docsAgent mode
When traffic comes in through more than one proxy or host, run one full instance plus an agent next to each log file. The agent tails, parses, geolocates and writes locally. The full instance owns everything else: the UI, the API, migrations, the scheduler and CrowdSec.
Every writer publishes committed events over PostgreSQL LISTEN/NOTIFY, so the live map shows a request the moment any agent stores it. Each source gets its own home beacon, and every page filters by recording hostname.
An agent needs four things: the mode, database credentials for the shared instance, MaxMind credentials, and its log mount. No admin password, no UI, no migrations.
APP_MODE=agent DB_HOST=timescale.example.internal LOGPARSER_LOG_PATHS=/var/log/access/access.log LOGPARSER_HOST_NAME=edge-01Multi-source setup in the docs
Install
The Compose file starts GeoMetrikks and TimescaleDB on amd64 or arm64. Set the log path and API keys, then open the app on port 8000.
# Docker. Images for amd64 and arm64. mkdir geometrikks && cd geometrikks curl -LO https://raw.githubusercontent.com/GilbN/geometrikks/main/docker-compose.yml curl -Lo .env https://raw.githubusercontent.com/GilbN/geometrikks/main/.env.example $EDITOR .env # set APP_ADMIN_PASSWORD, MaxMind key, CARTO key, log path docker compose up -d # open http://localhost:8000
Built with