The app, page by page
What each page in the GeoMetrikks web UI shows, in the order the navigation lists them.
The sidebar lists the pages in this order. On a phone the tab bar holds Overview, Map, Access Logs and either Security or Analytics, and More holds the rest. Security only appears once CrowdSec is set up or AbuseIPDB reporting is on, and then takes the fourth place in the tab bar. Without either, Analytics takes it.
Most pages read the time range picker in the header, and Access Logs, Geo Logs, Analytics and the map keep their filters in the page URL, so a filtered view is a link you can share. Wherever an IP address appears in a table, the button after it opens the IP actions menu. The IP inspector page covers what it offers.
Overview
Traffic, status codes and response times for the selected range, each figure with its trend against the previous range of the same length. The page has four sections: Traffic Overview, Traffic Origin, HTTP Status Codes, and Performance & Bandwidth. The Charts switch in the header draws a small chart under each figure; on a phone it is in the time range drawer.
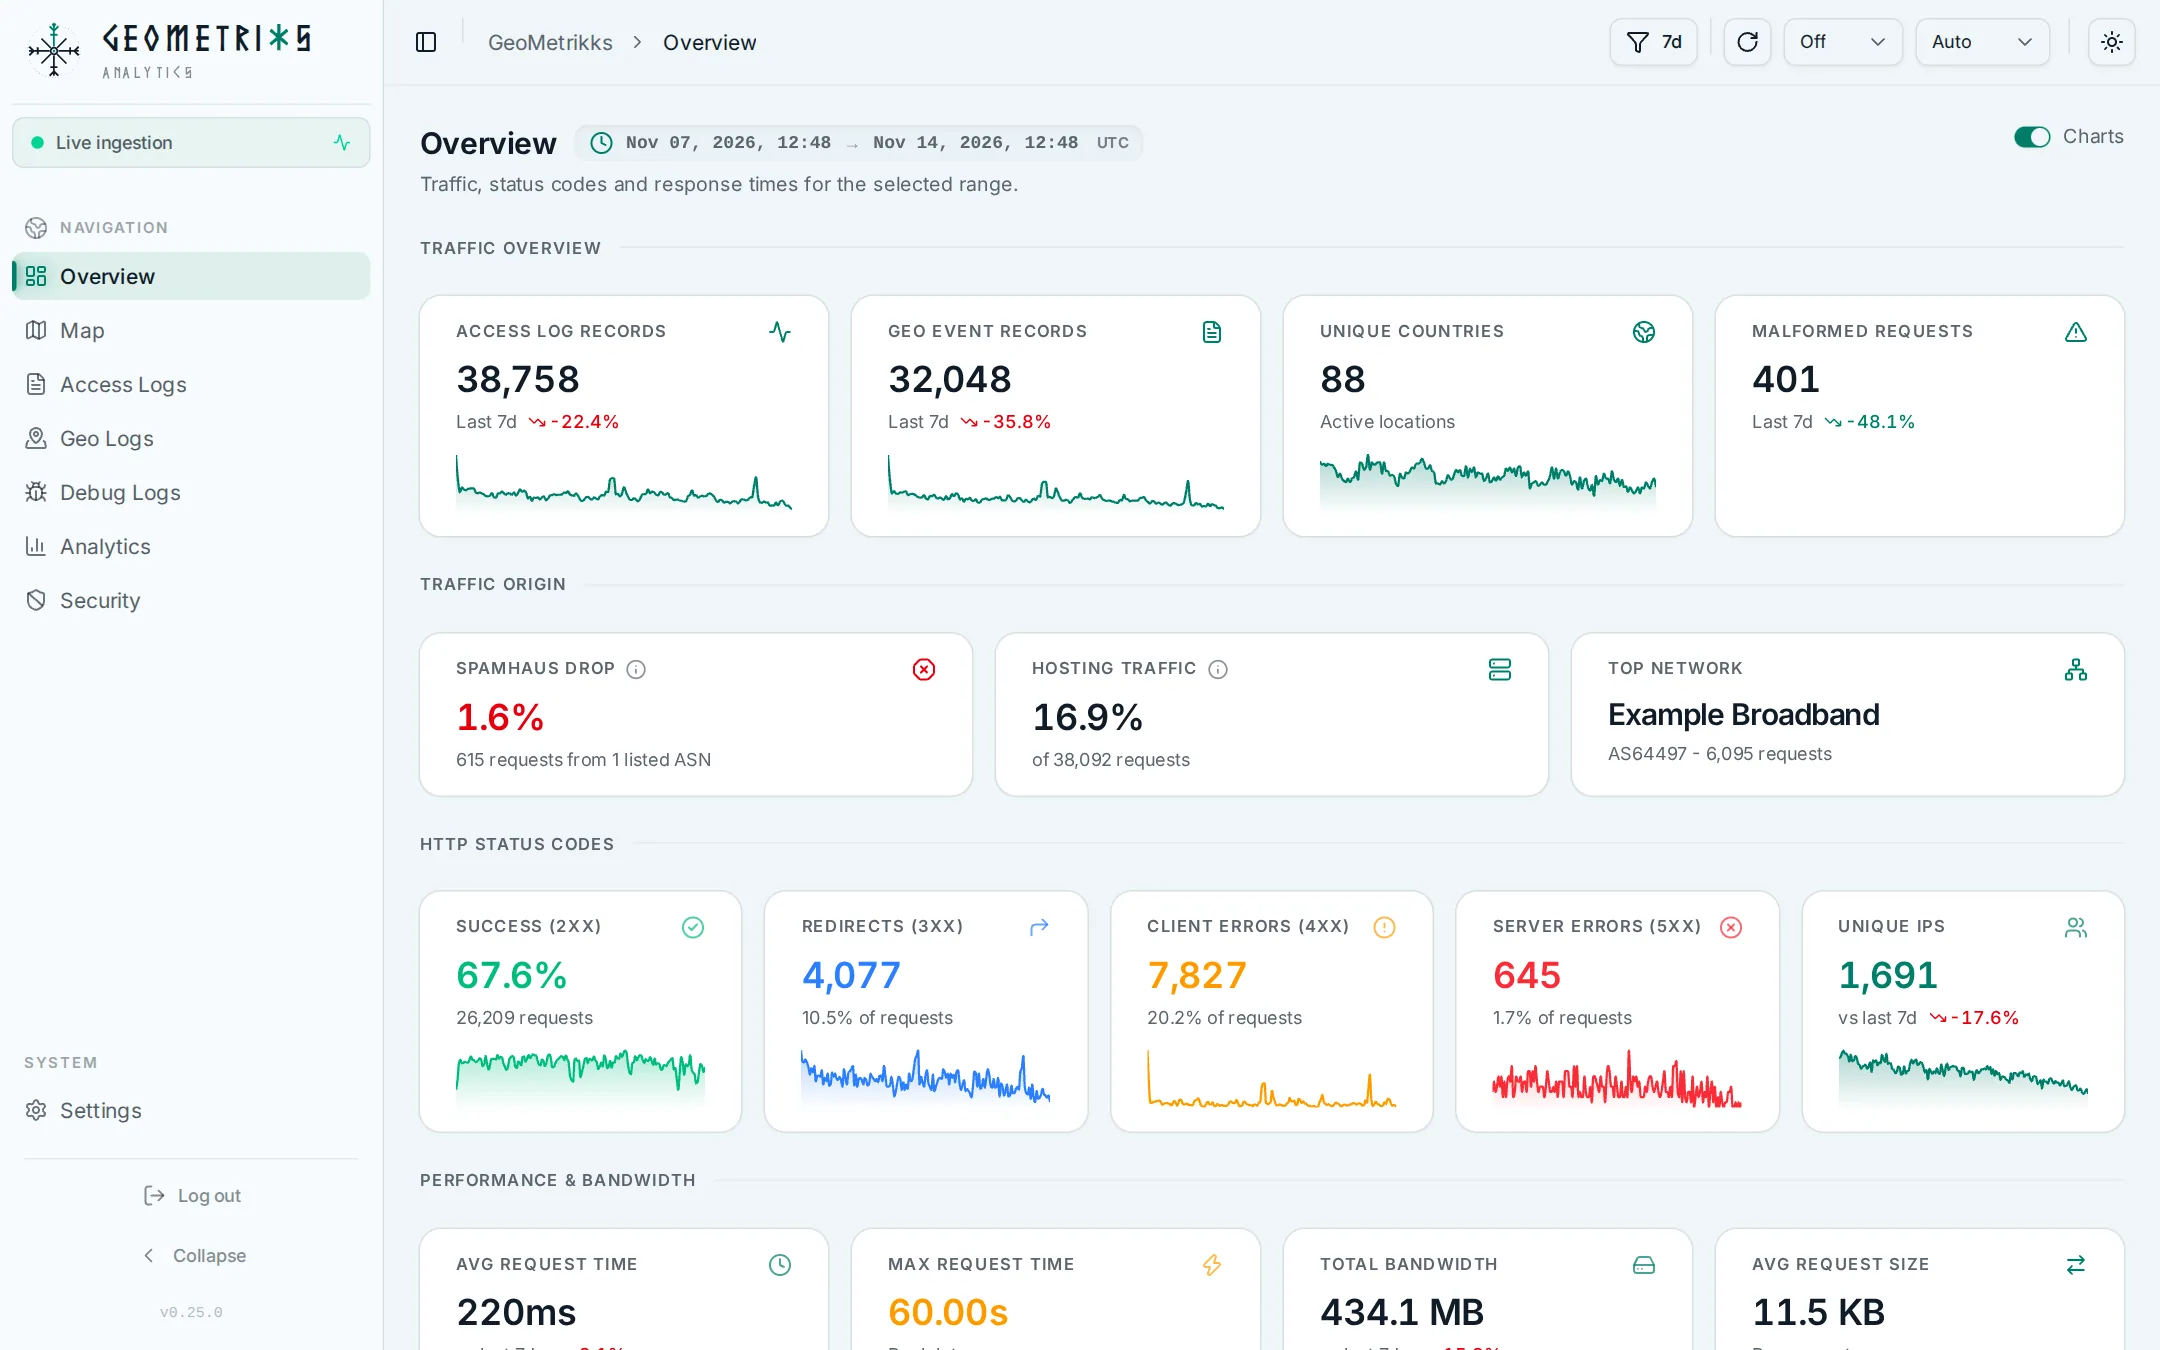
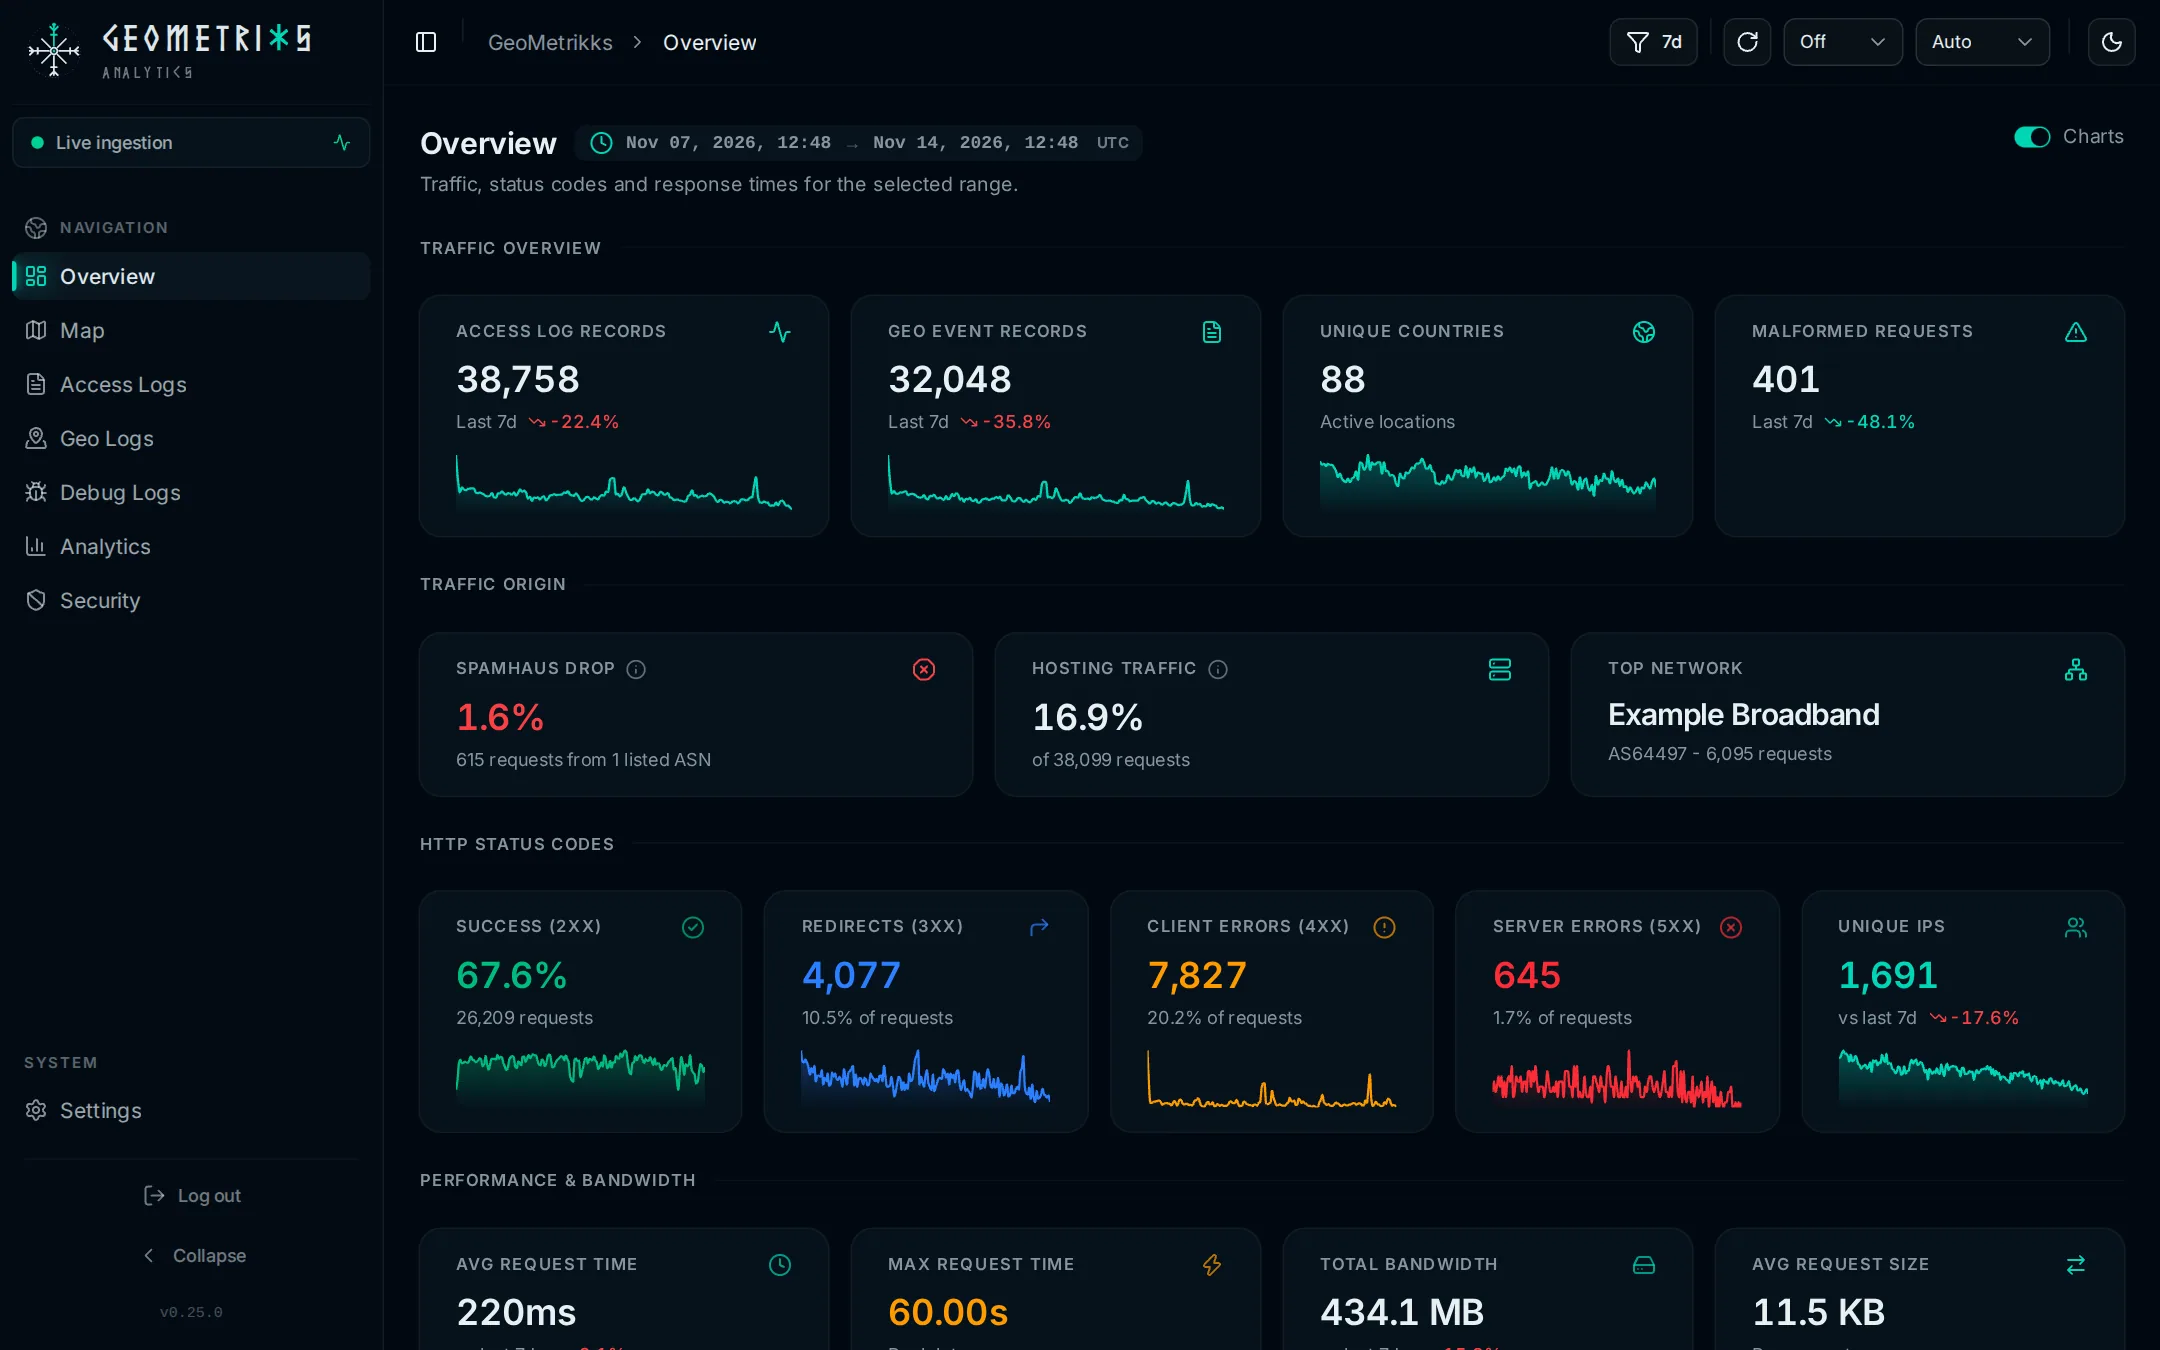
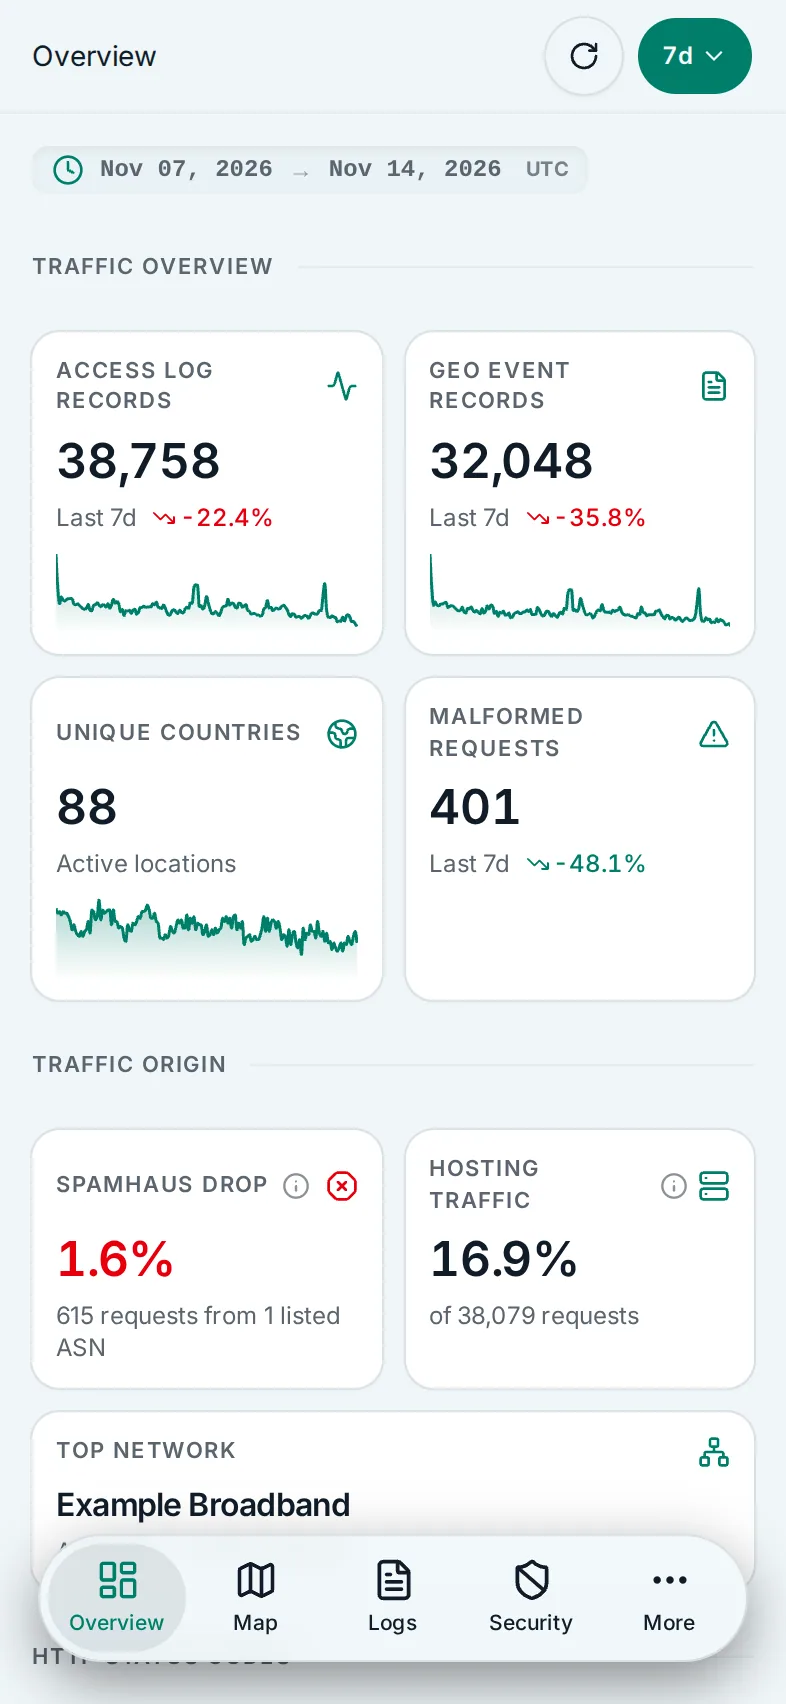
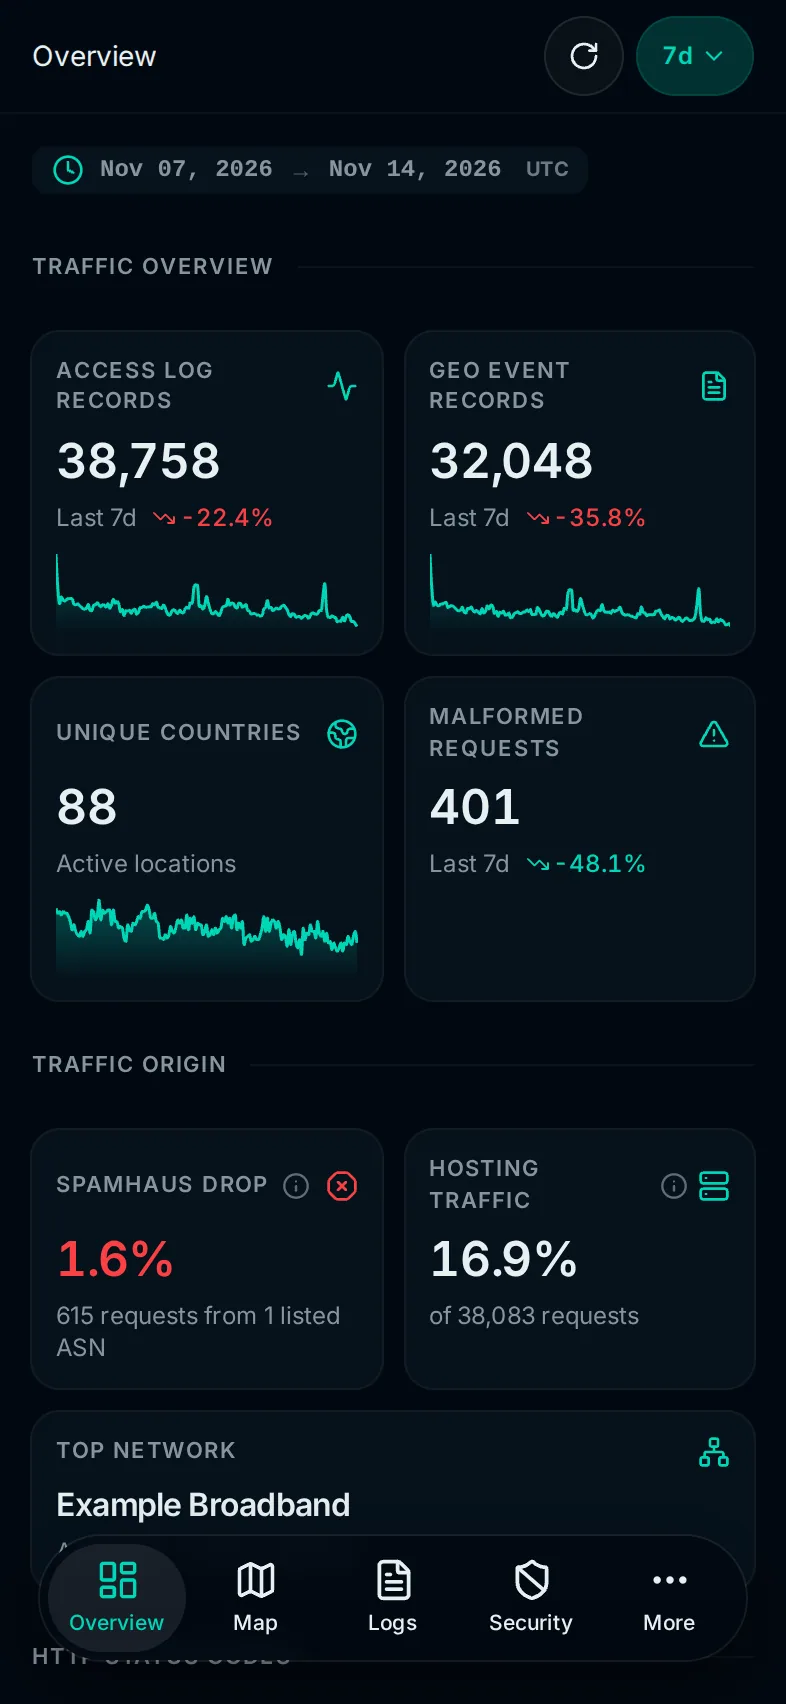
Traffic Origin splits the range's traffic by the network it came from:
- Spamhaus DROP is the share of requests from networks on Spamhaus's ASN-DROP list, with the count of listed ASNs that sent them. It appears once the DROP lists have downloaded. See Spamhaus DROP lists.
- Hosting Traffic is the share from networks on a bundled community list of hosting, VPN and datacenter operators. Settings > About has the list.
- Top Network is the AS that sent the most requests.
Both shares are of classified requests, the ones with ASN data. When part of the range has none, for example history from before ASN lookups or with GEOIP_ASN_ENABLED=false, the subtitle says how much of the range the share covers. With no ASN data in the range the section doesn't show at all.
Map
The live world map, with heatmap, markers and a banned view, live routes to each server, and the live rail. See Map.
Access Logs
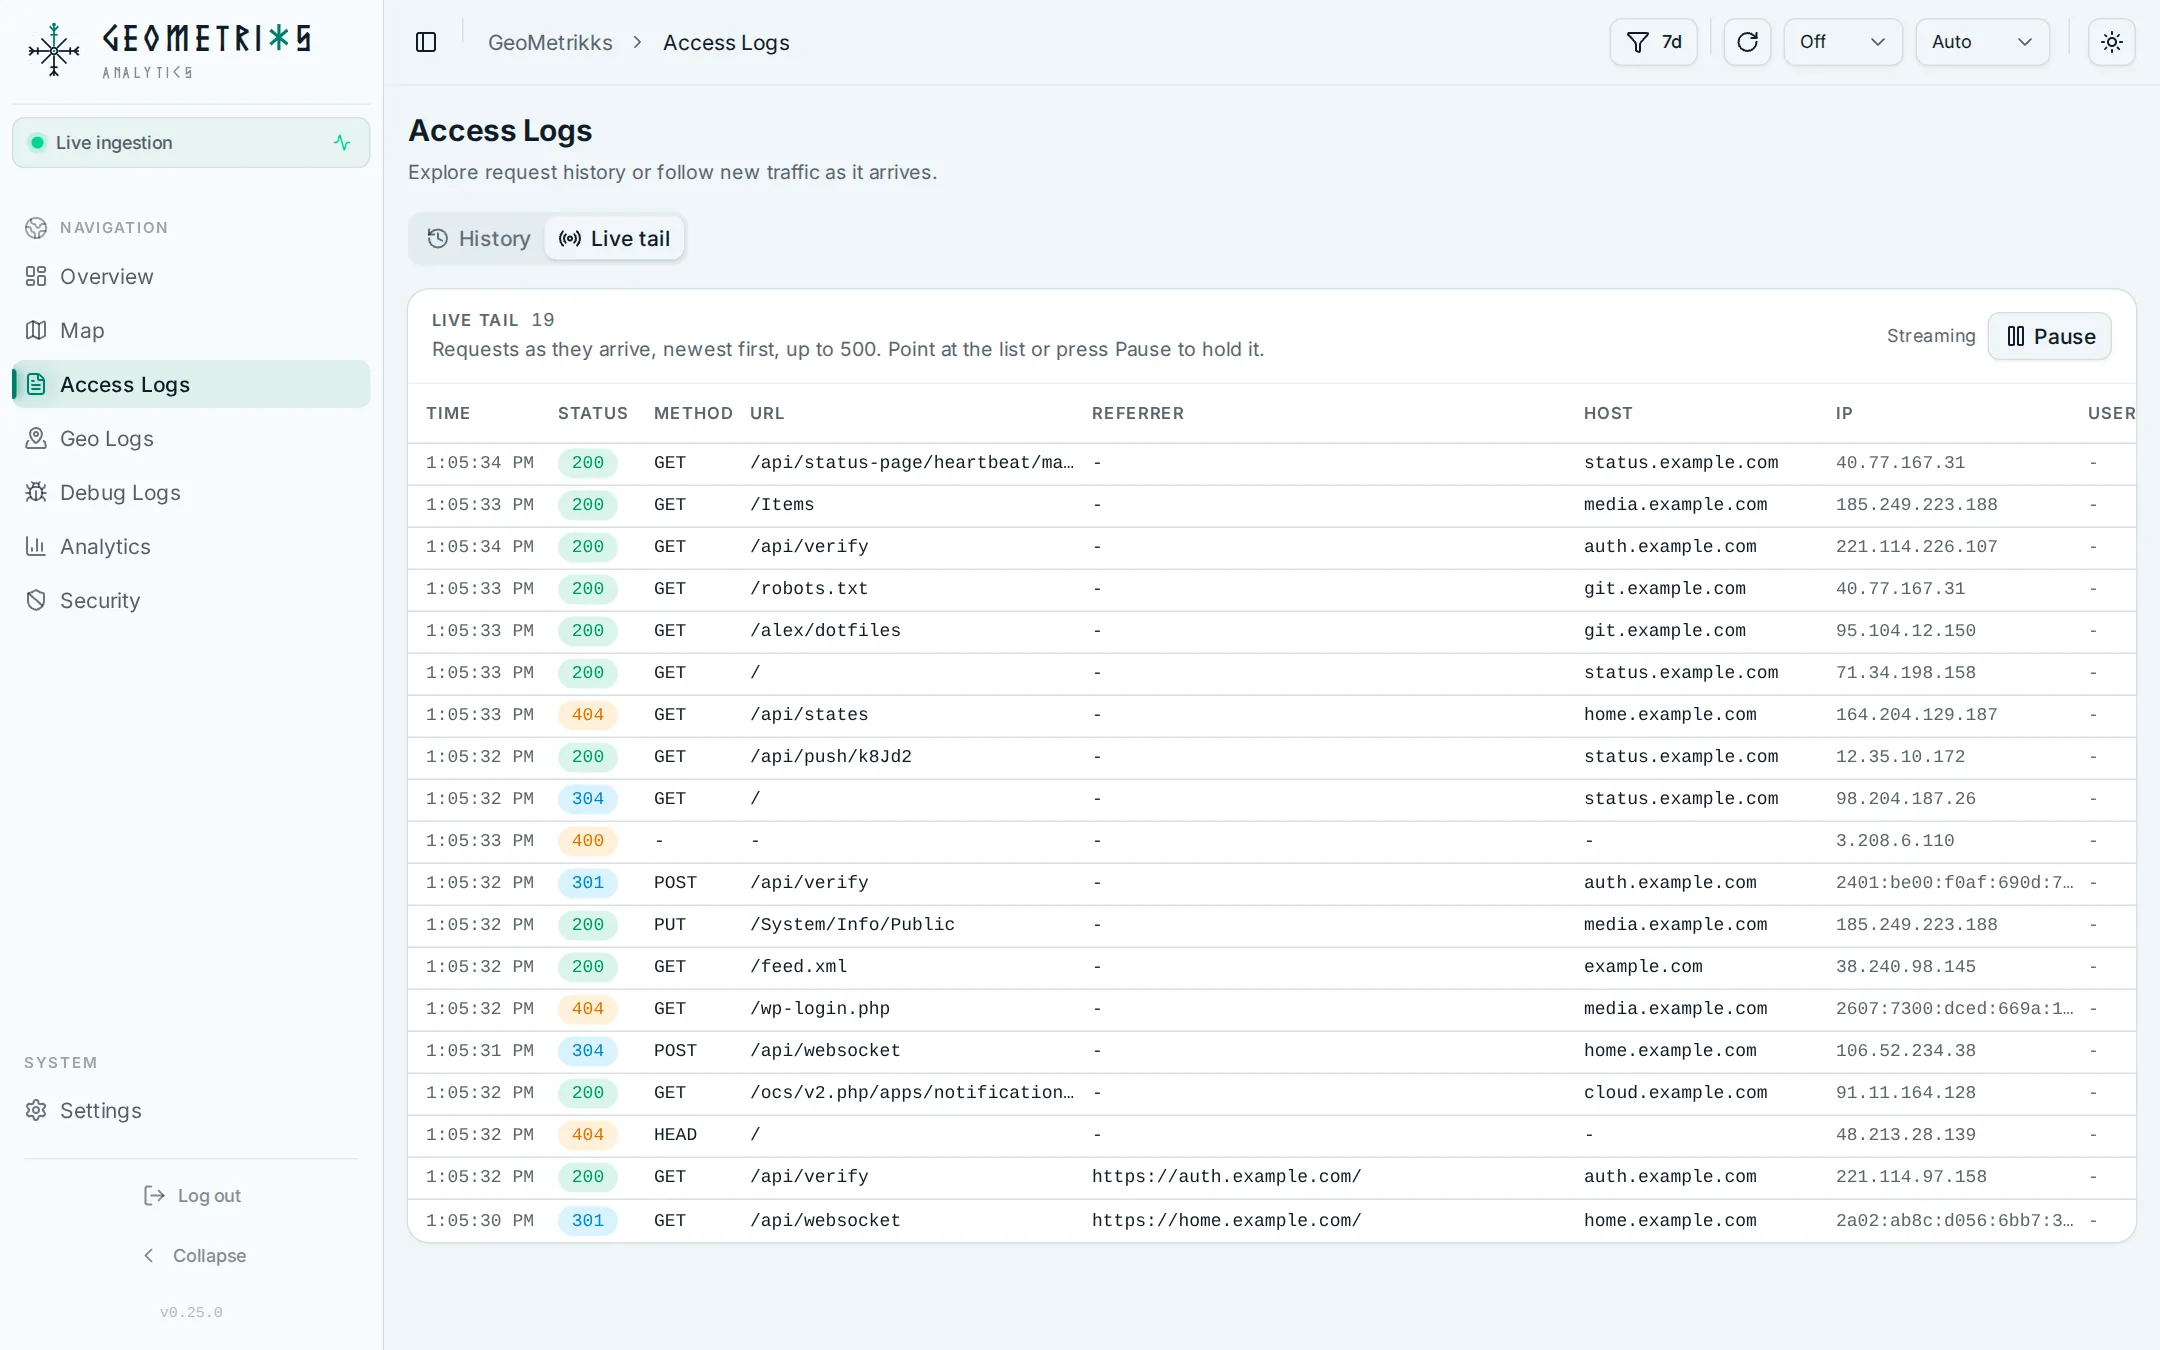
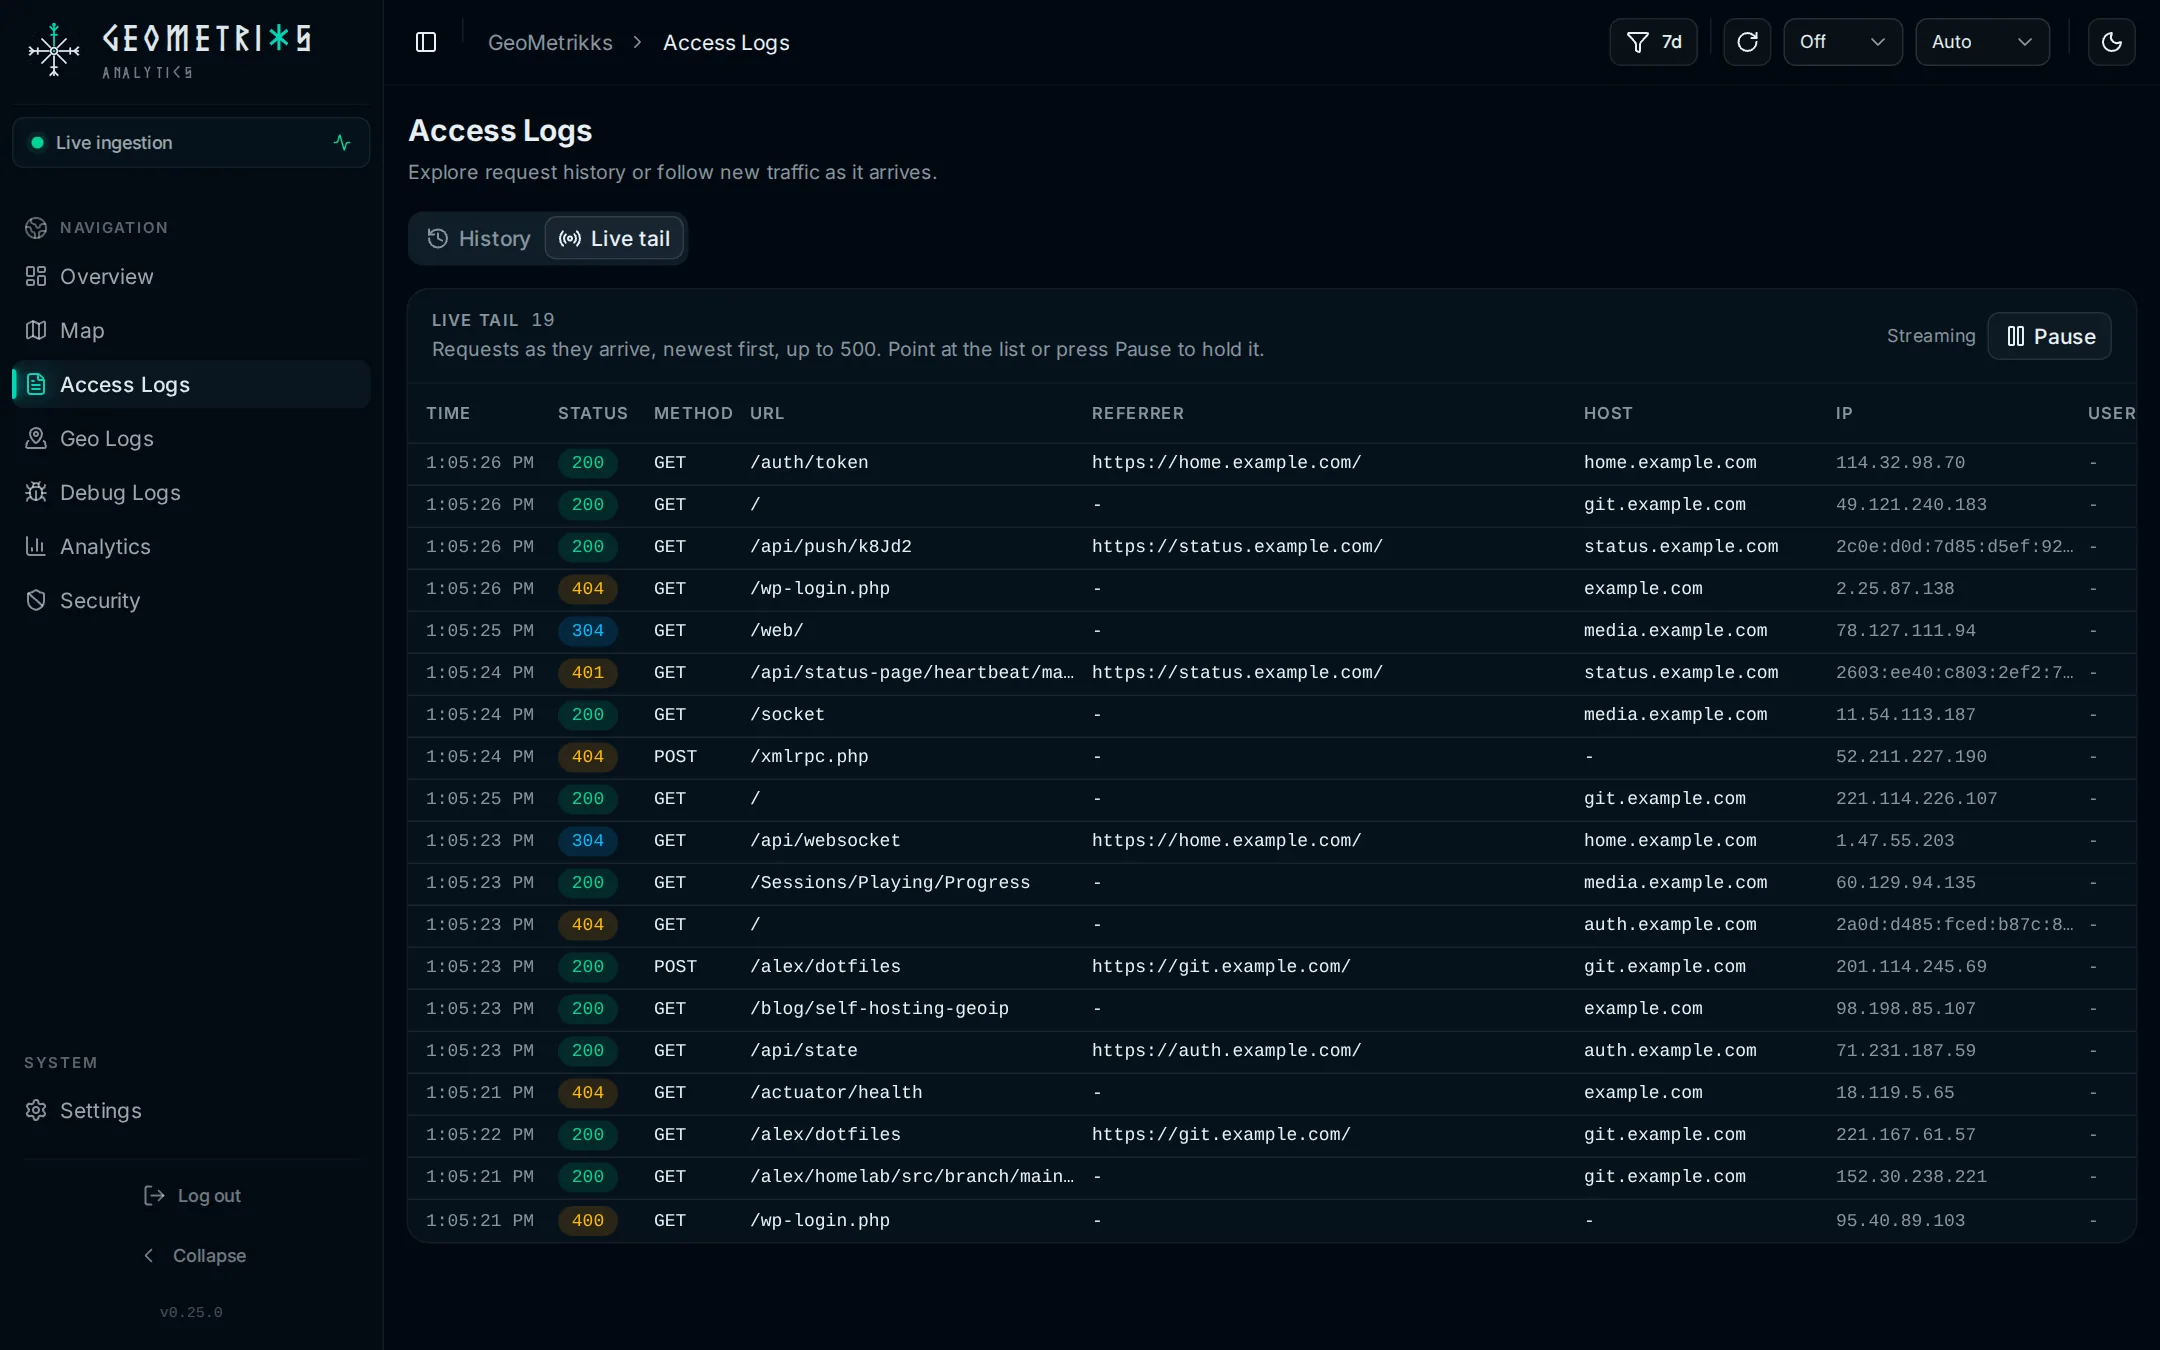
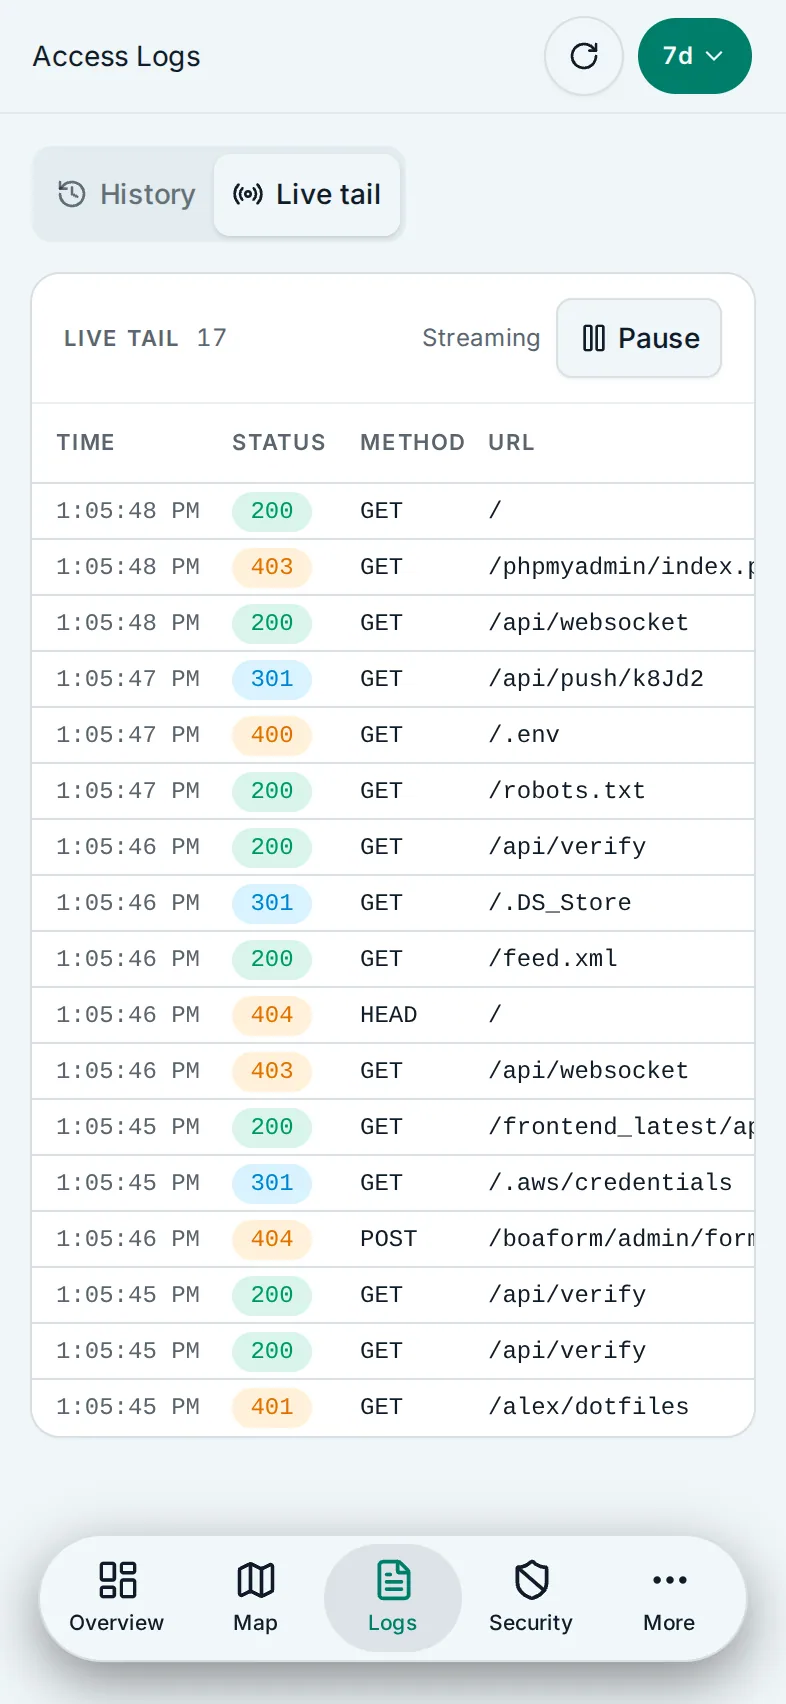
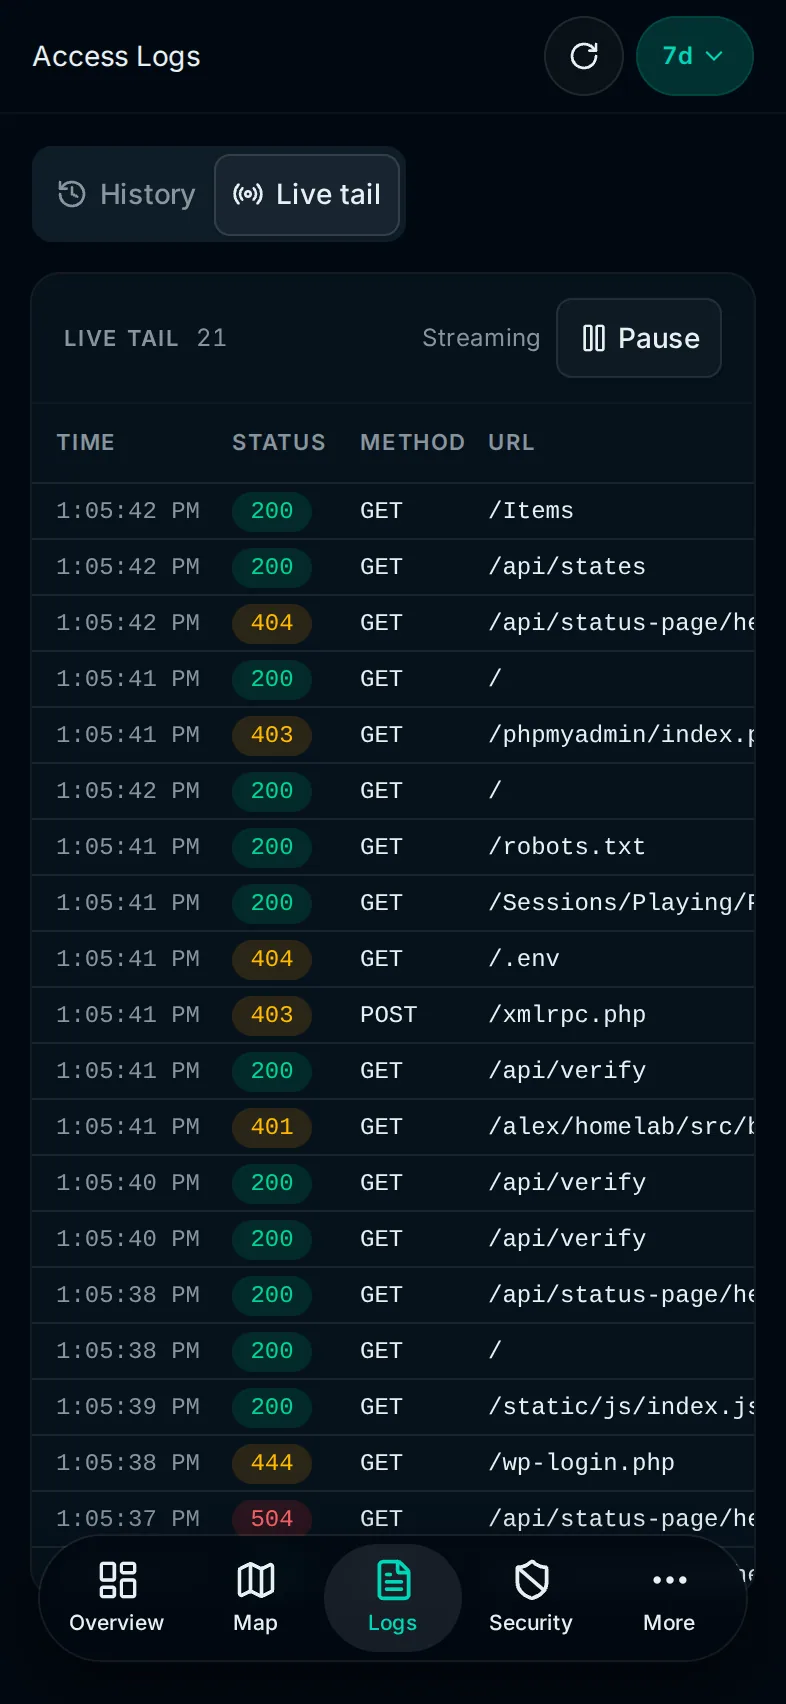
Every stored request, newest first, in two tabs: History and Live tail.
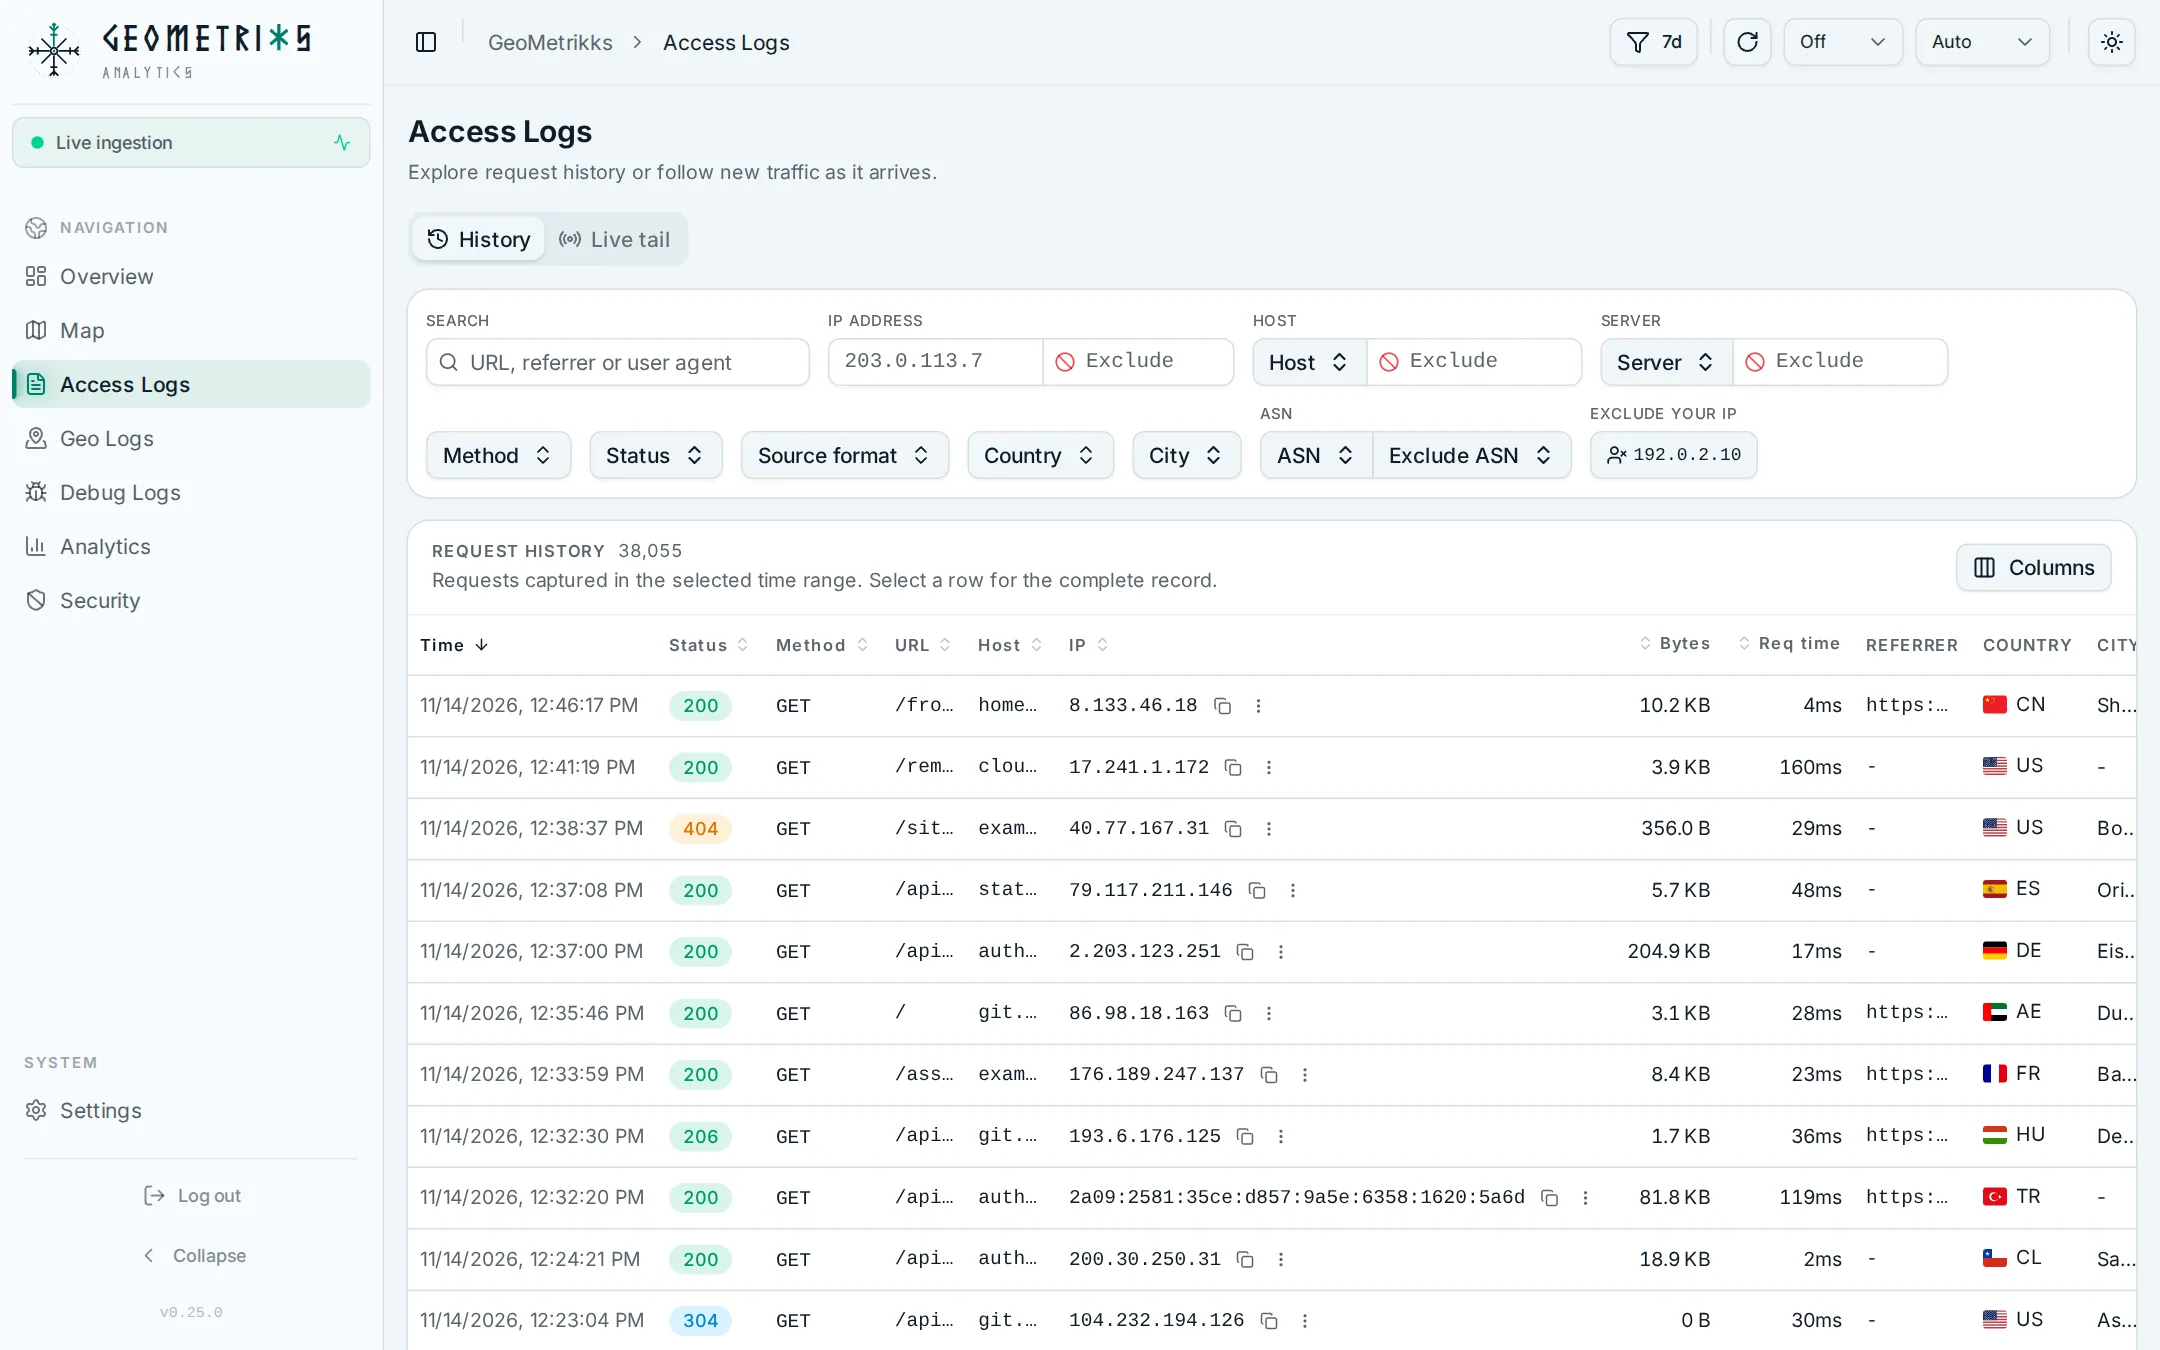
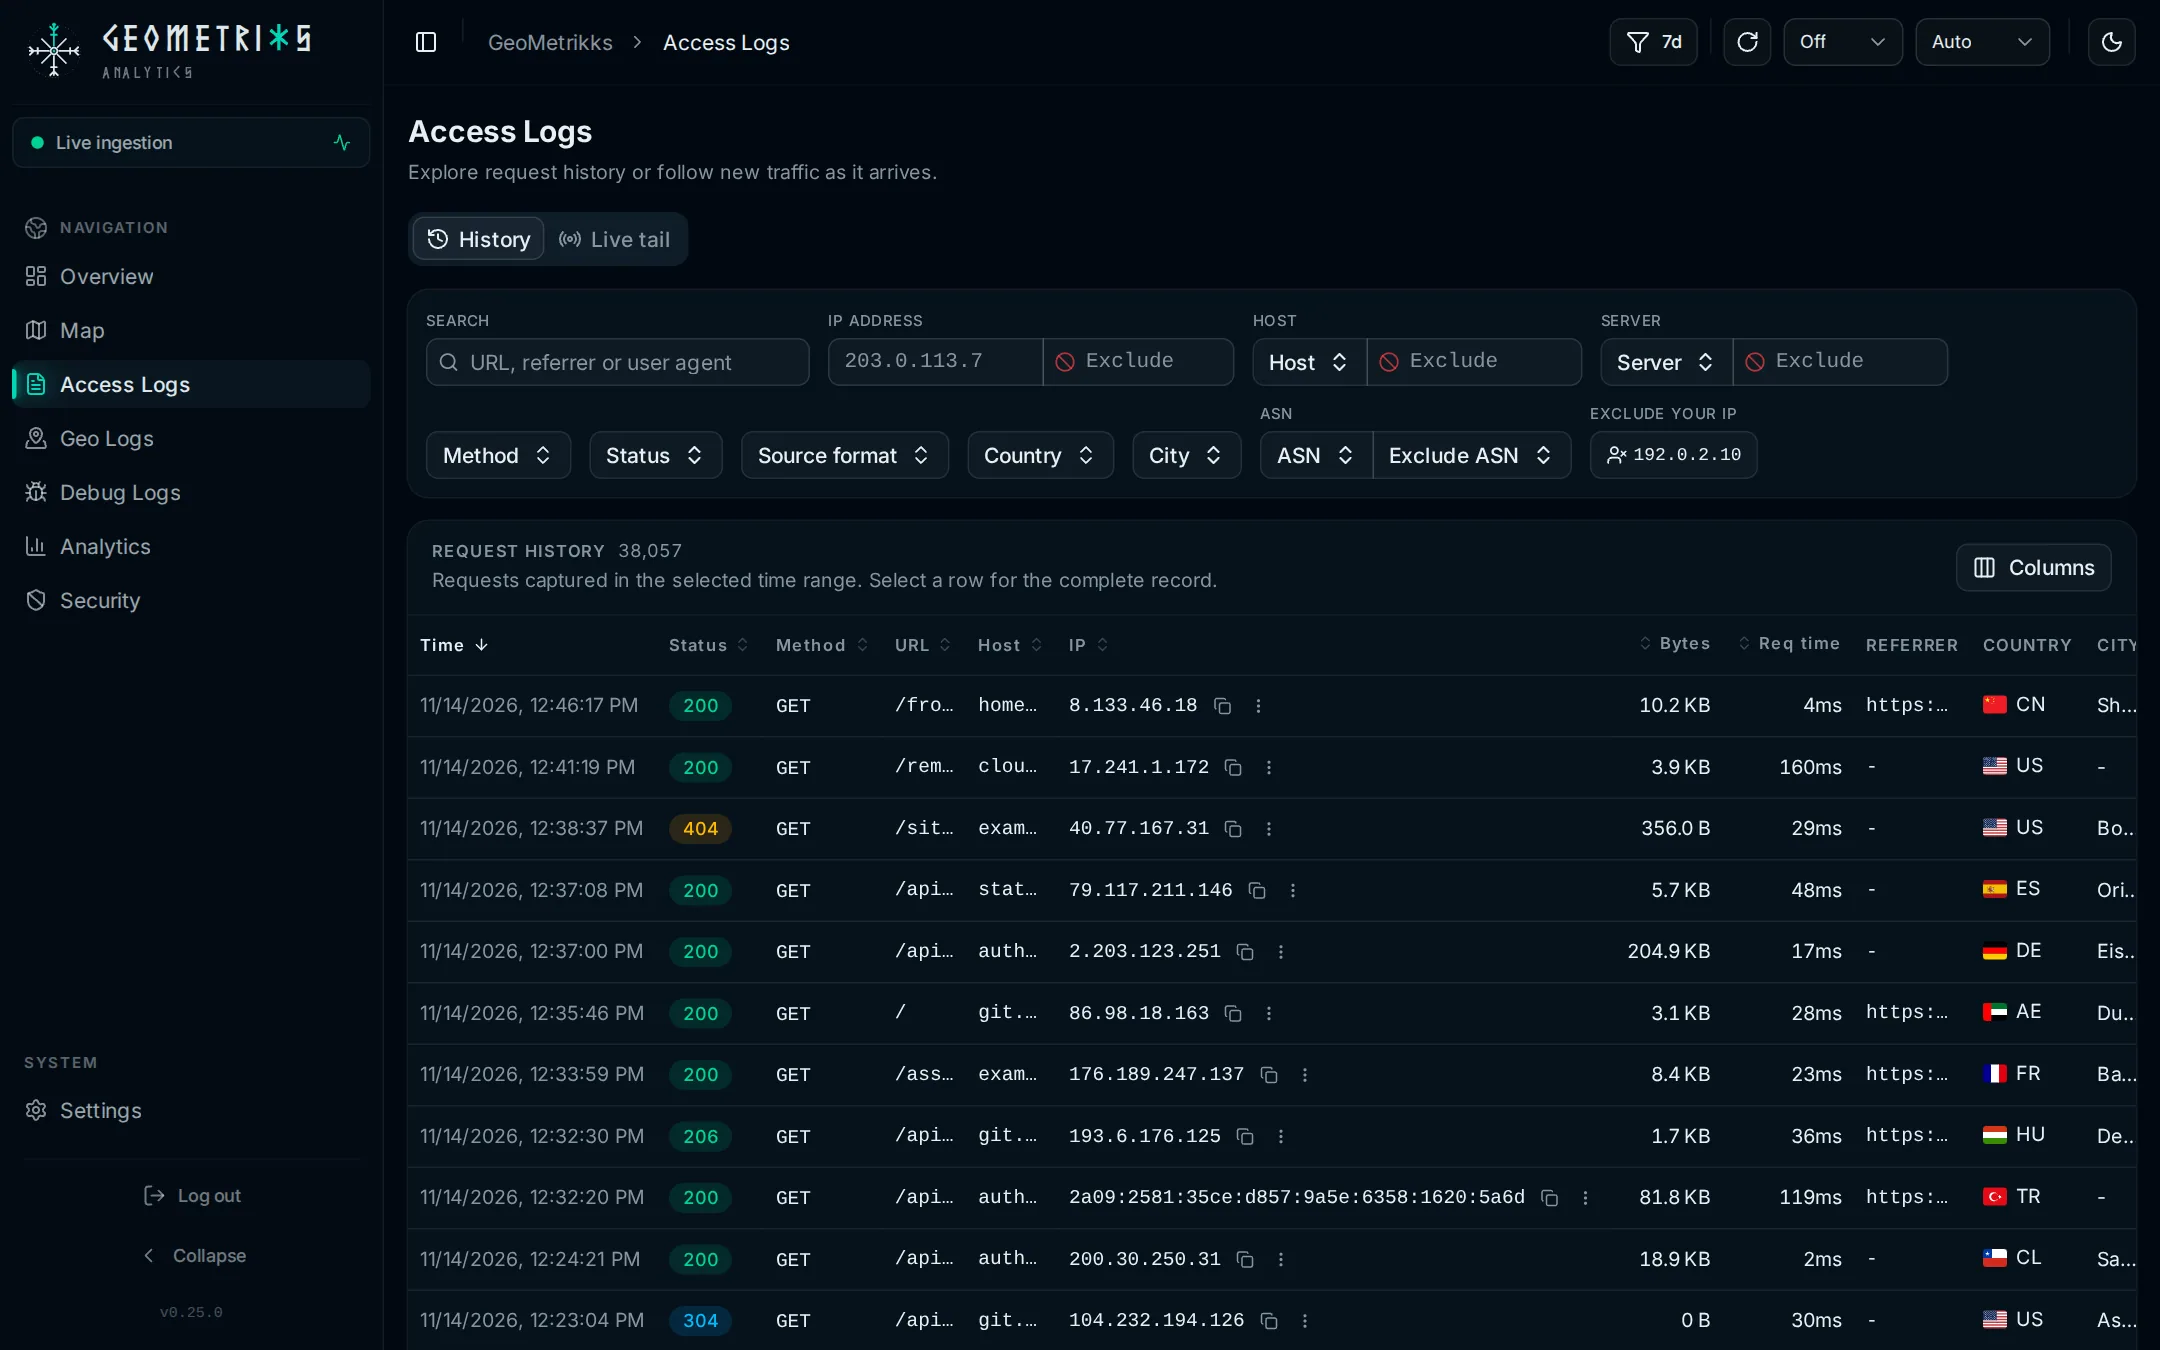
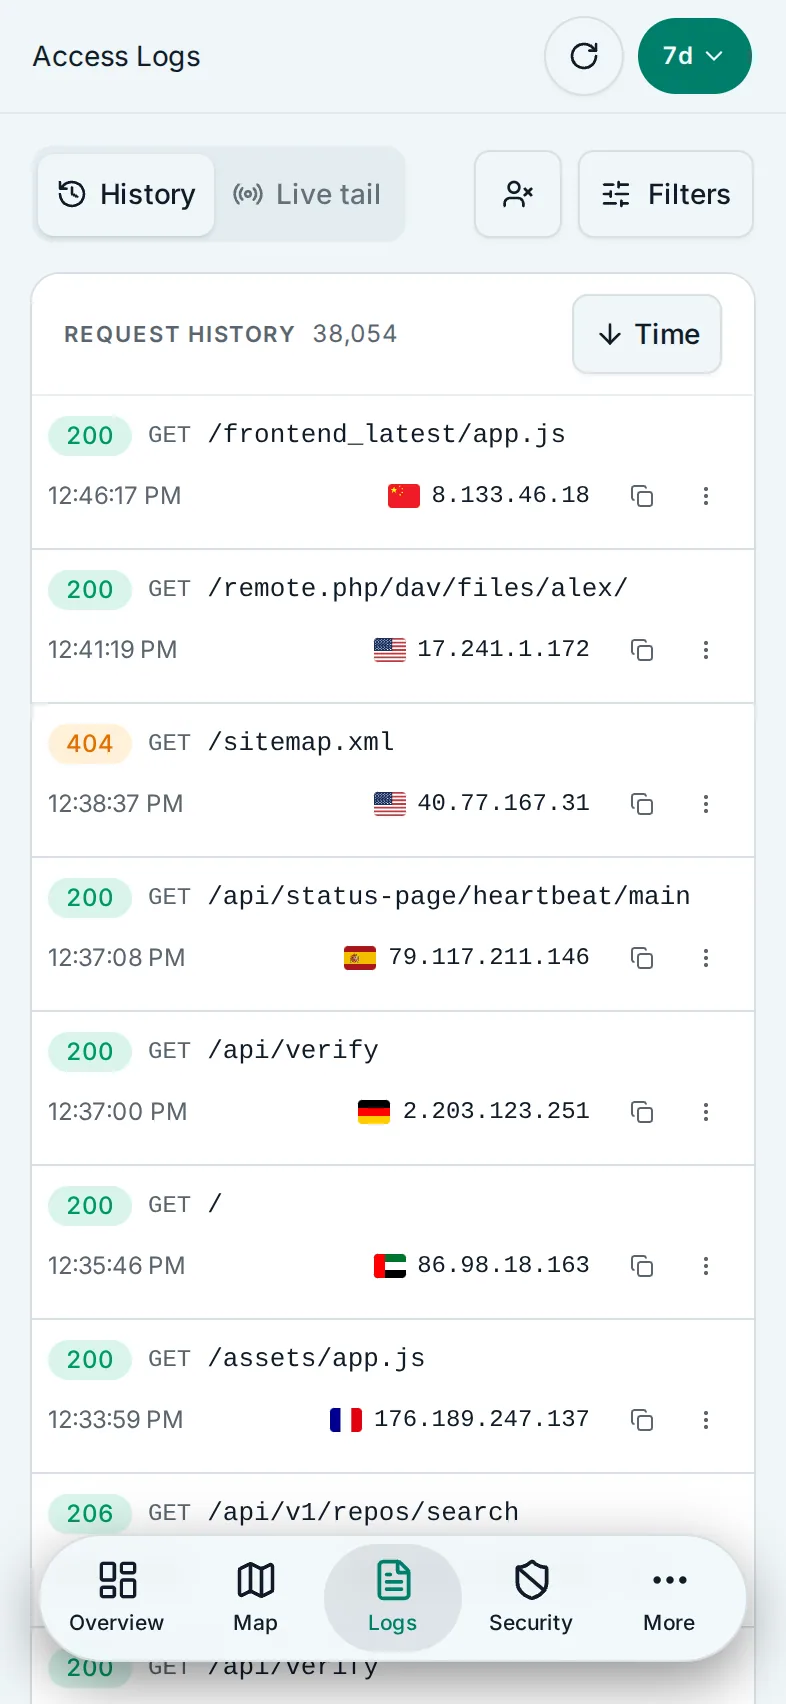
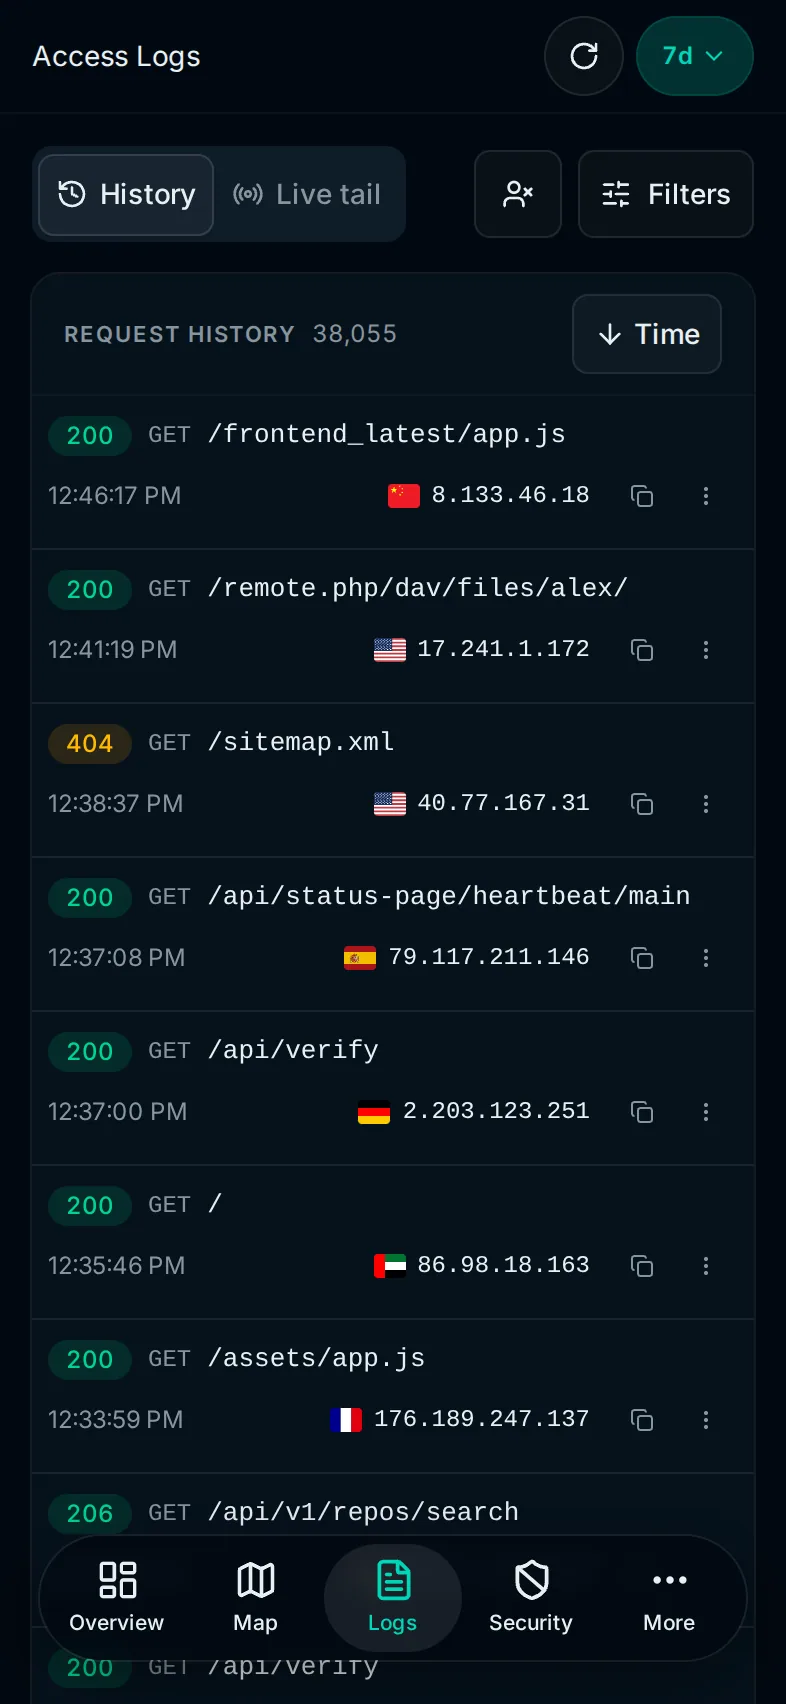
History is the searchable table. Search matches the URL, referrer and user agent. Filters cover IP address, host, server, method, status, source format, country, city and ASN, and IP address, host, server and ASN each have an exclude field next to them: Exclude IP, Exclude host, Exclude server and Exclude ASN. Exclude your IP drops your own address from the view. On a phone the filters sit in a drawer, split into Show only and Exclude. Click a row for the full record. Bytes and Req time show by default, except on a phone. The column picker adds upstream response time, HTTP version, remote user, user agent, server, source format, ASN and AS organization.
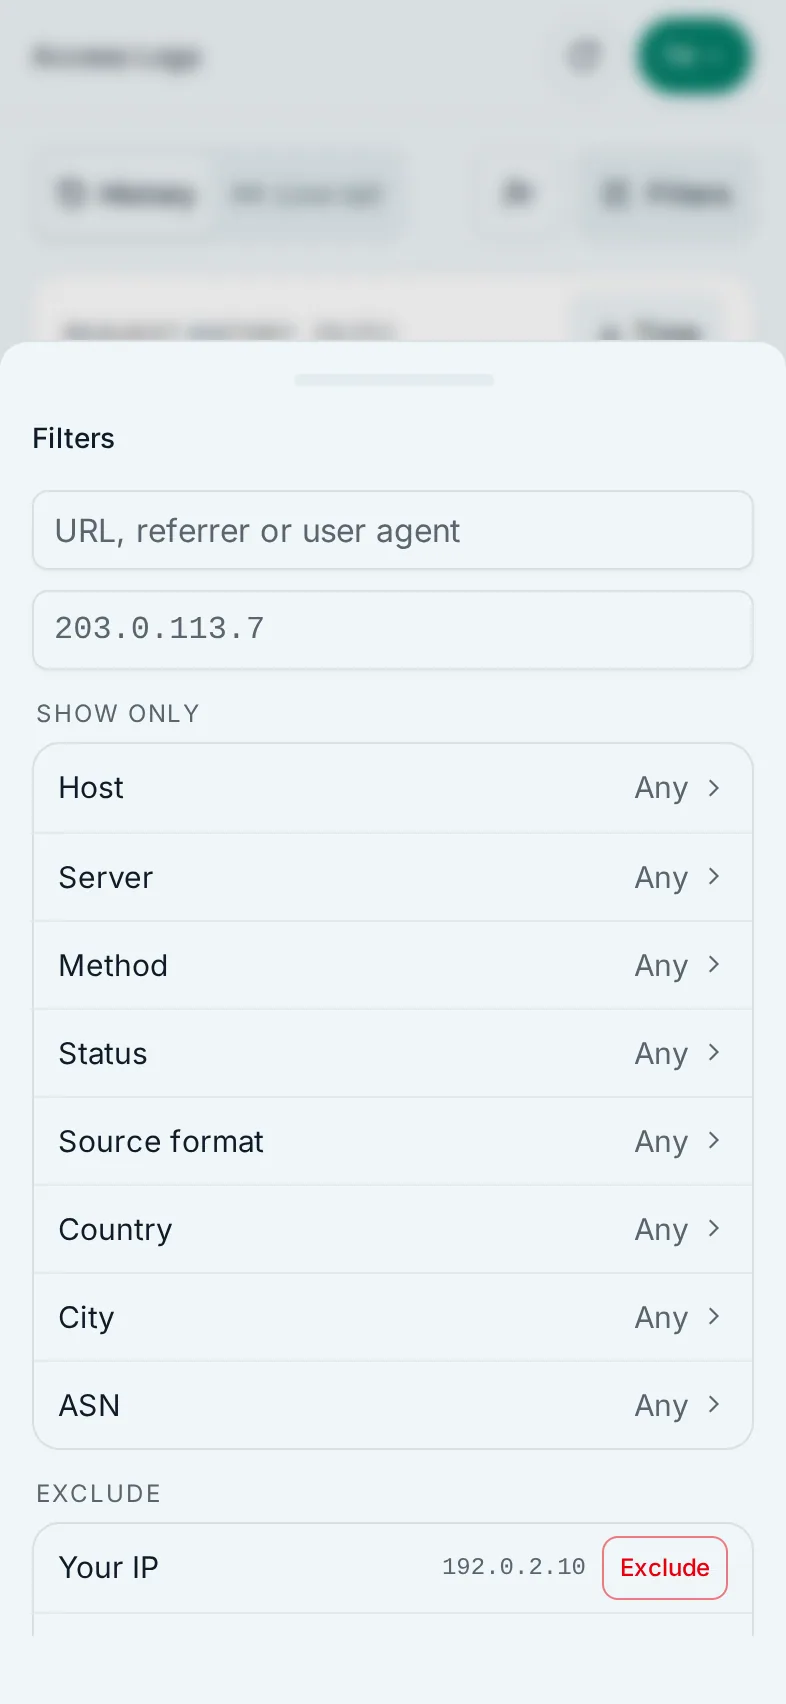
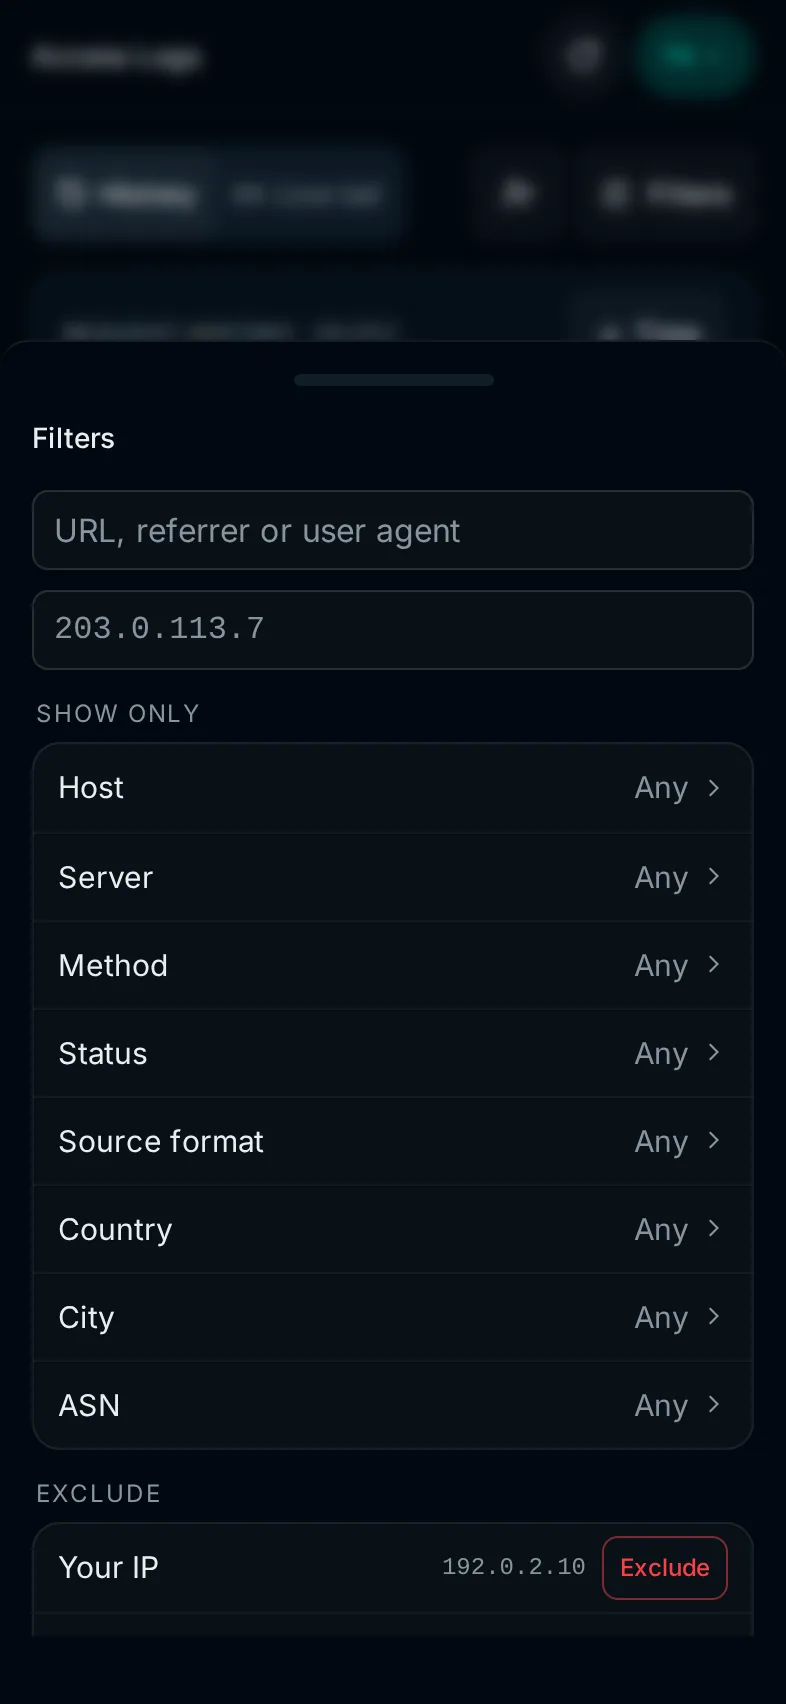
The IP actions menu on each row can also filter by the row's IP, host, server, country or ASN, and exclude the values that have an exclude field.
Live tail
Live tail shows new requests as your proxy logs them. It keeps the most recent few hundred rows and pauses while the pointer is over the list. The pause button works on every device, and on a touch screen it is the only way to pause. Requests that arrive while it is paused wait in a buffer and appear when you resume. The History filters don't apply to it.
Geo Logs
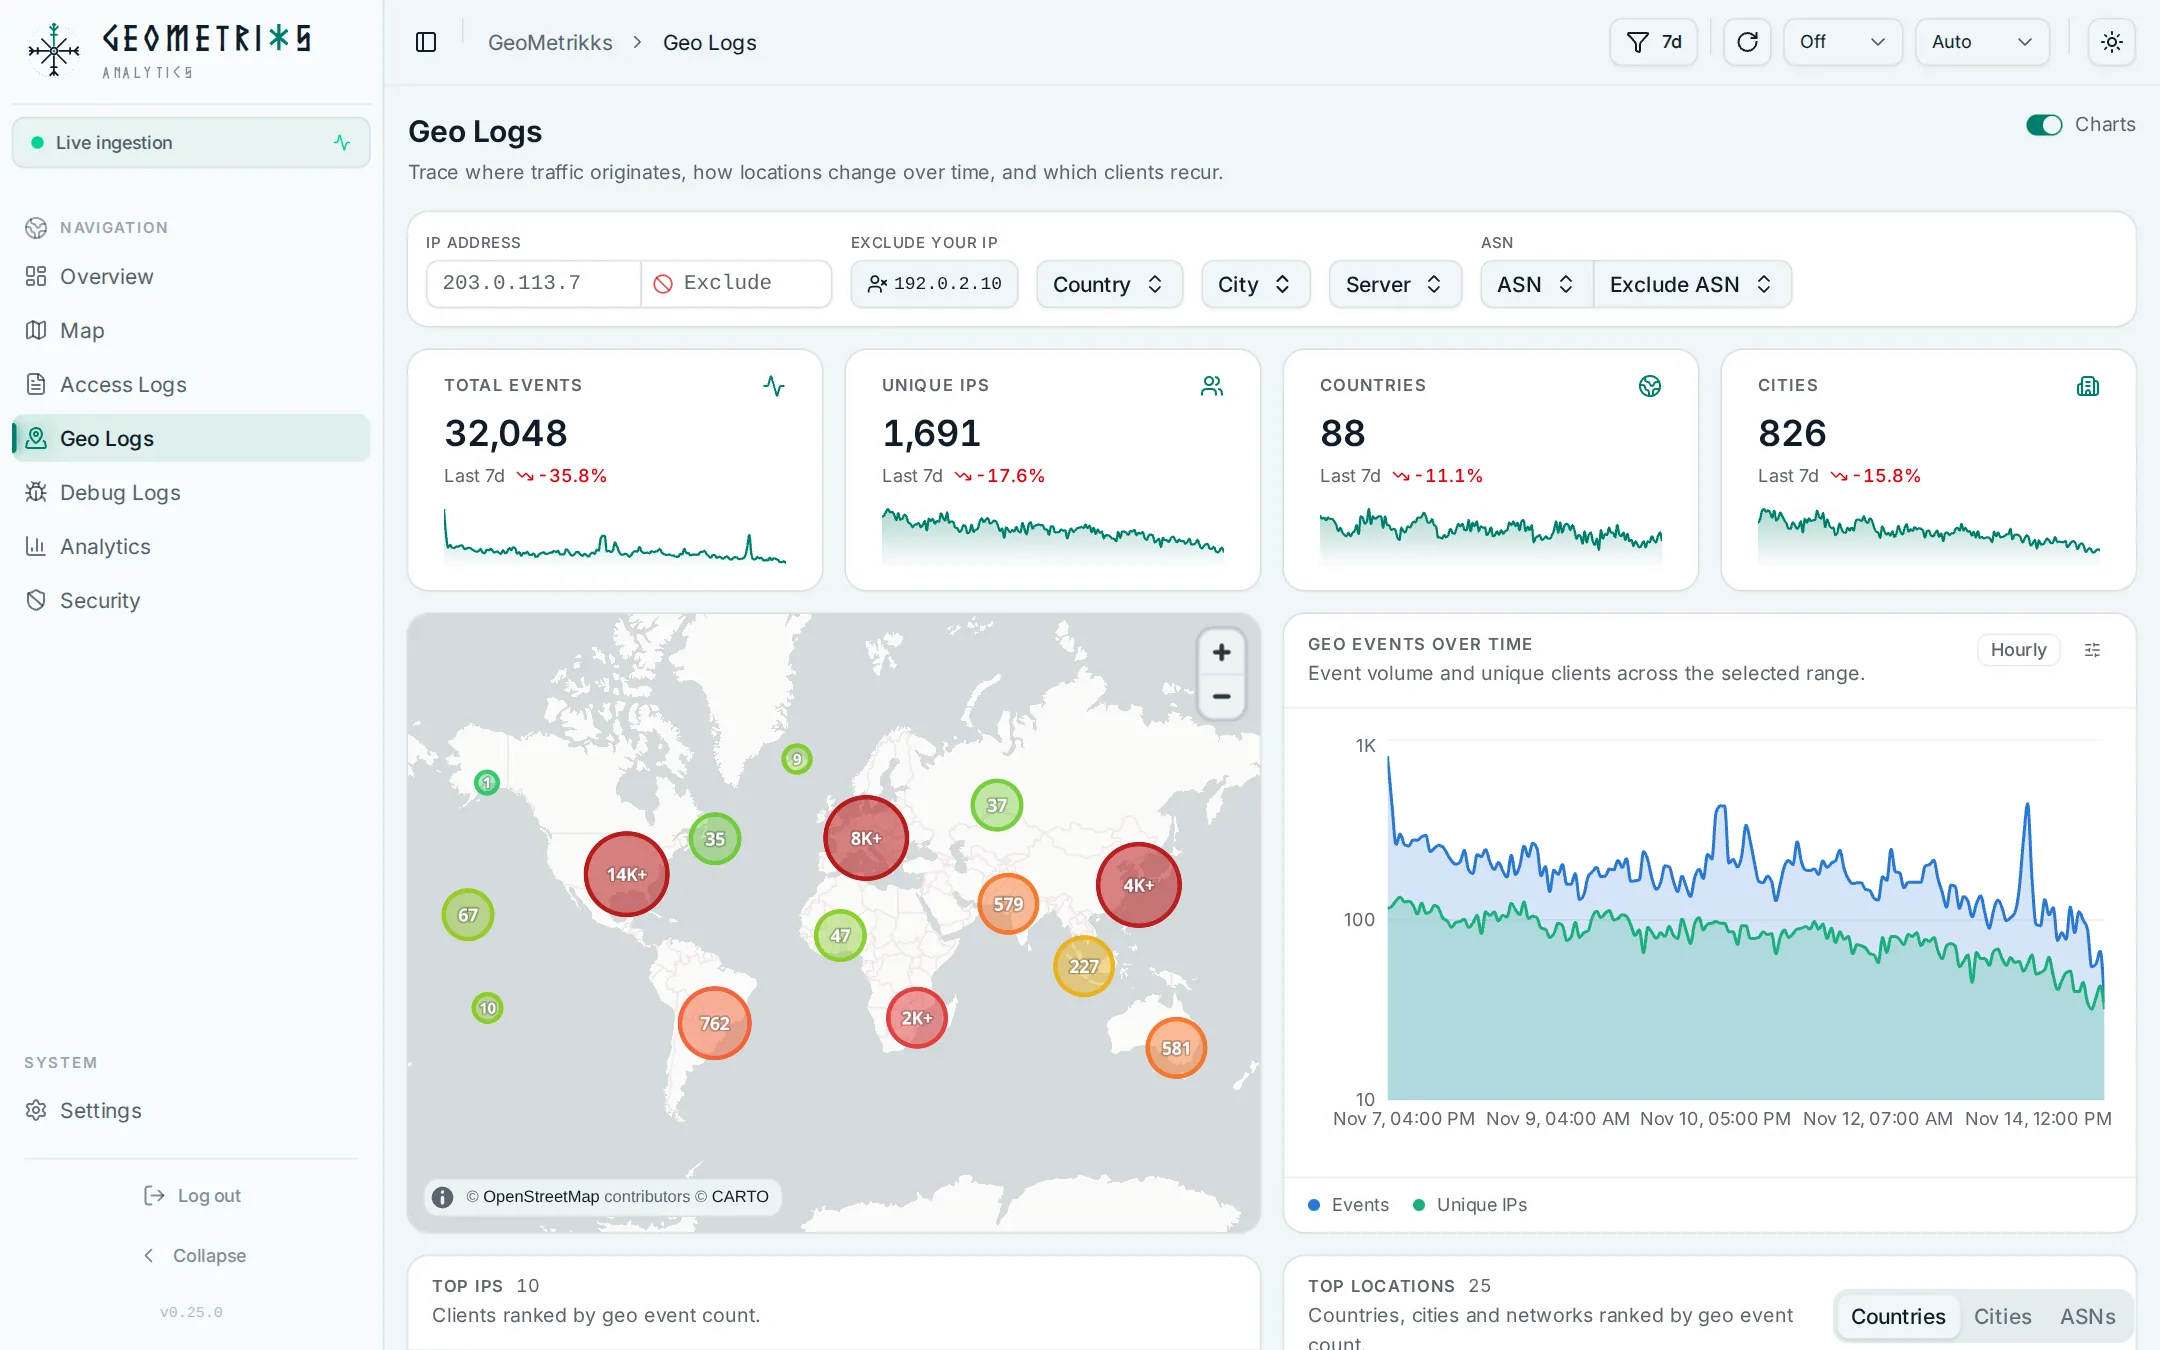
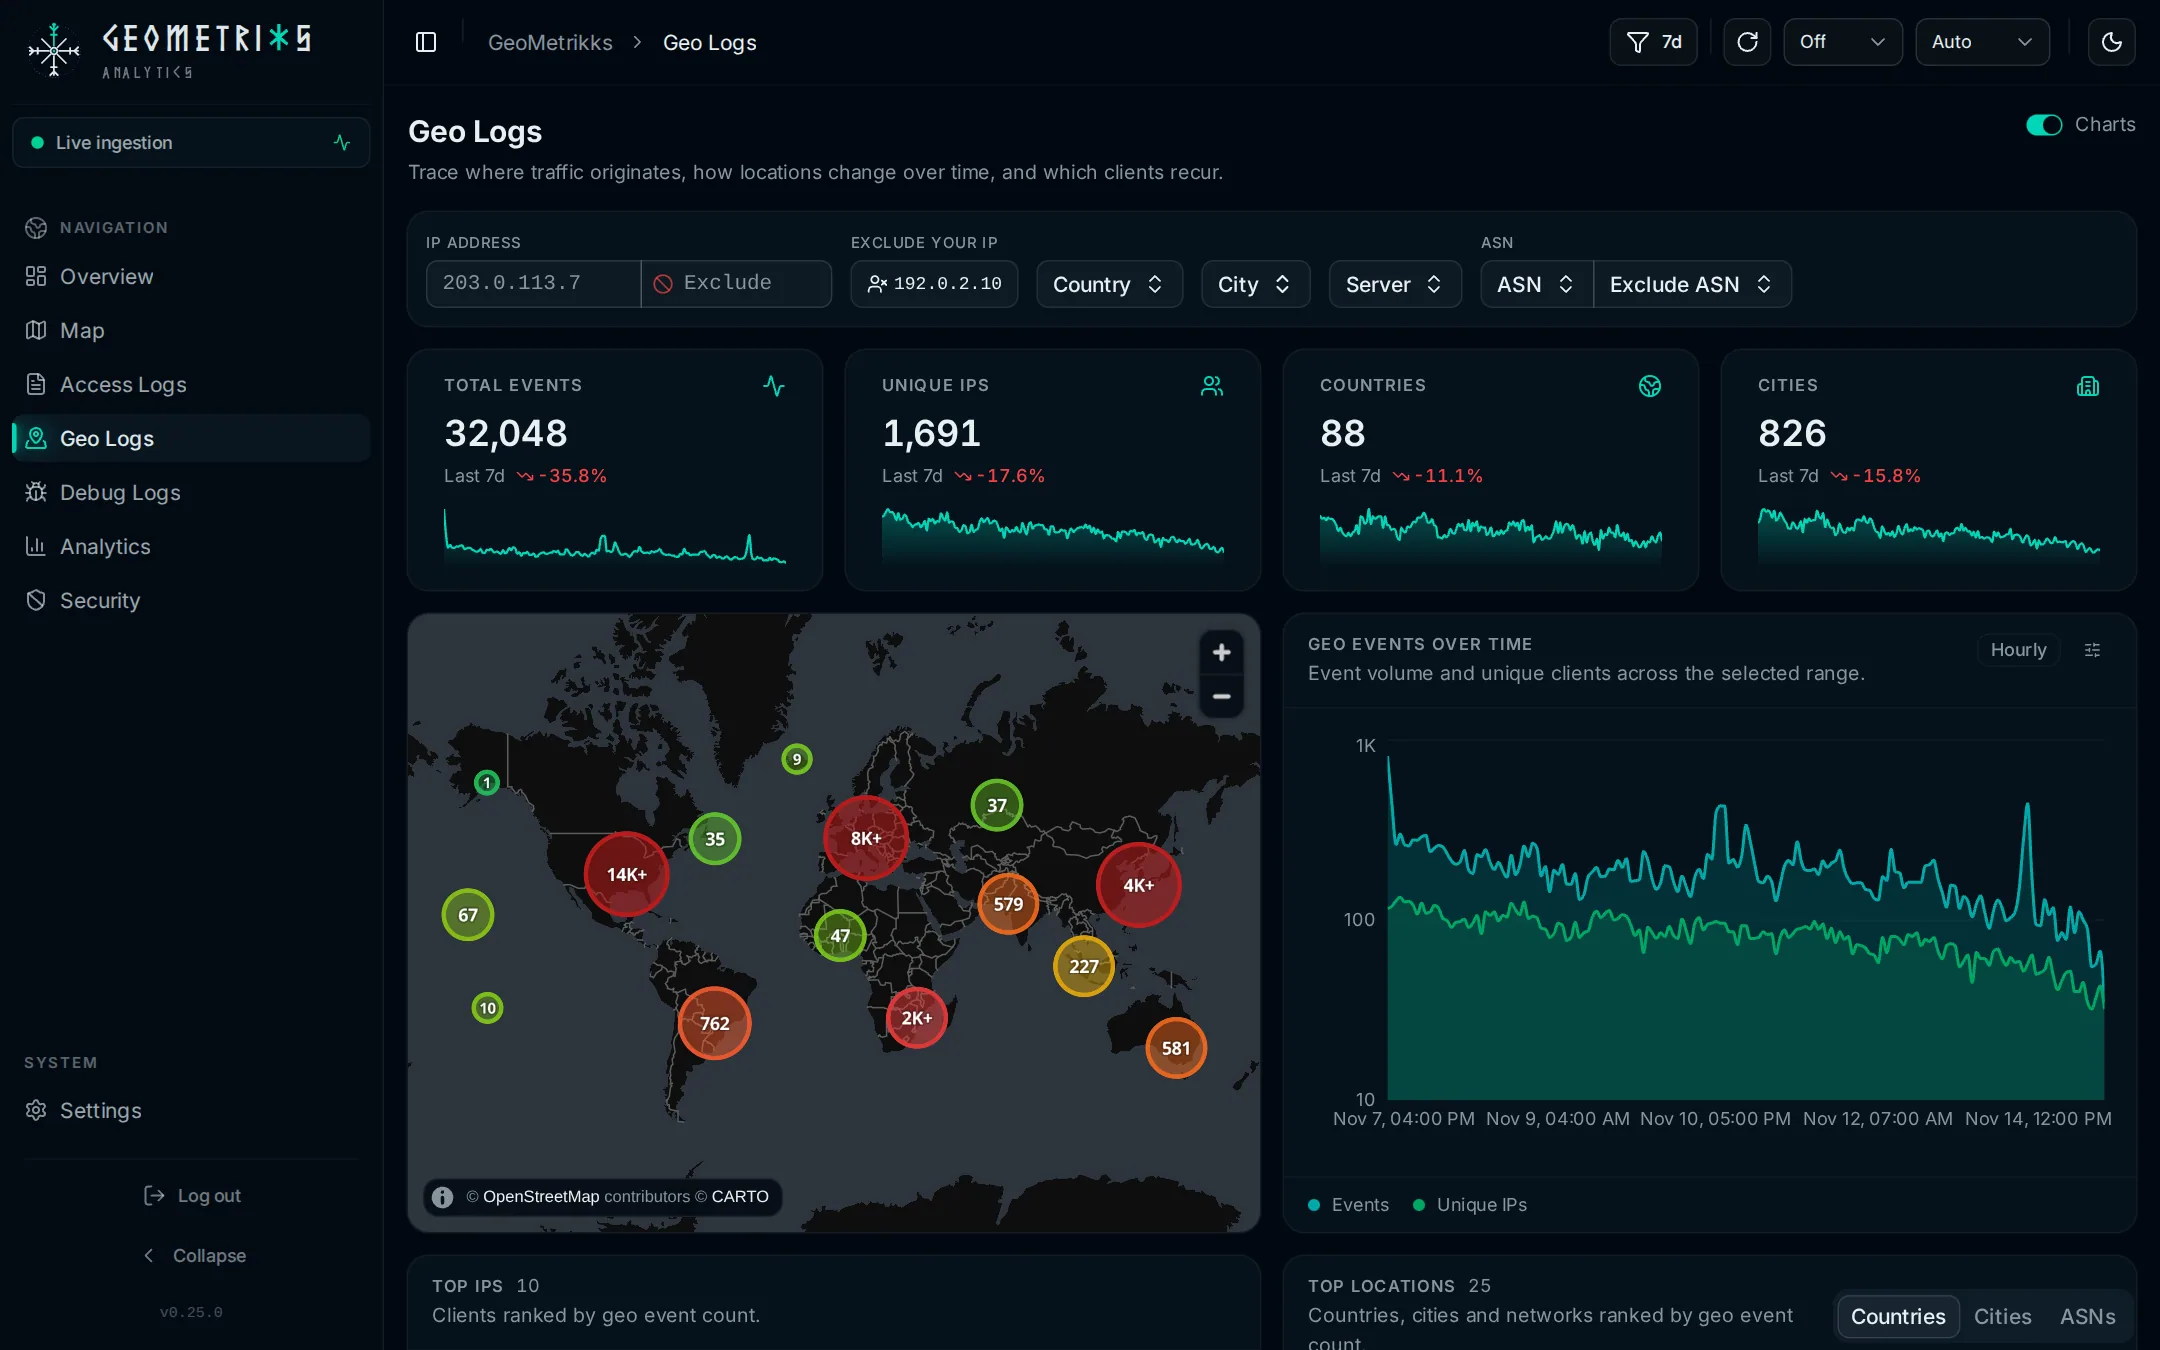
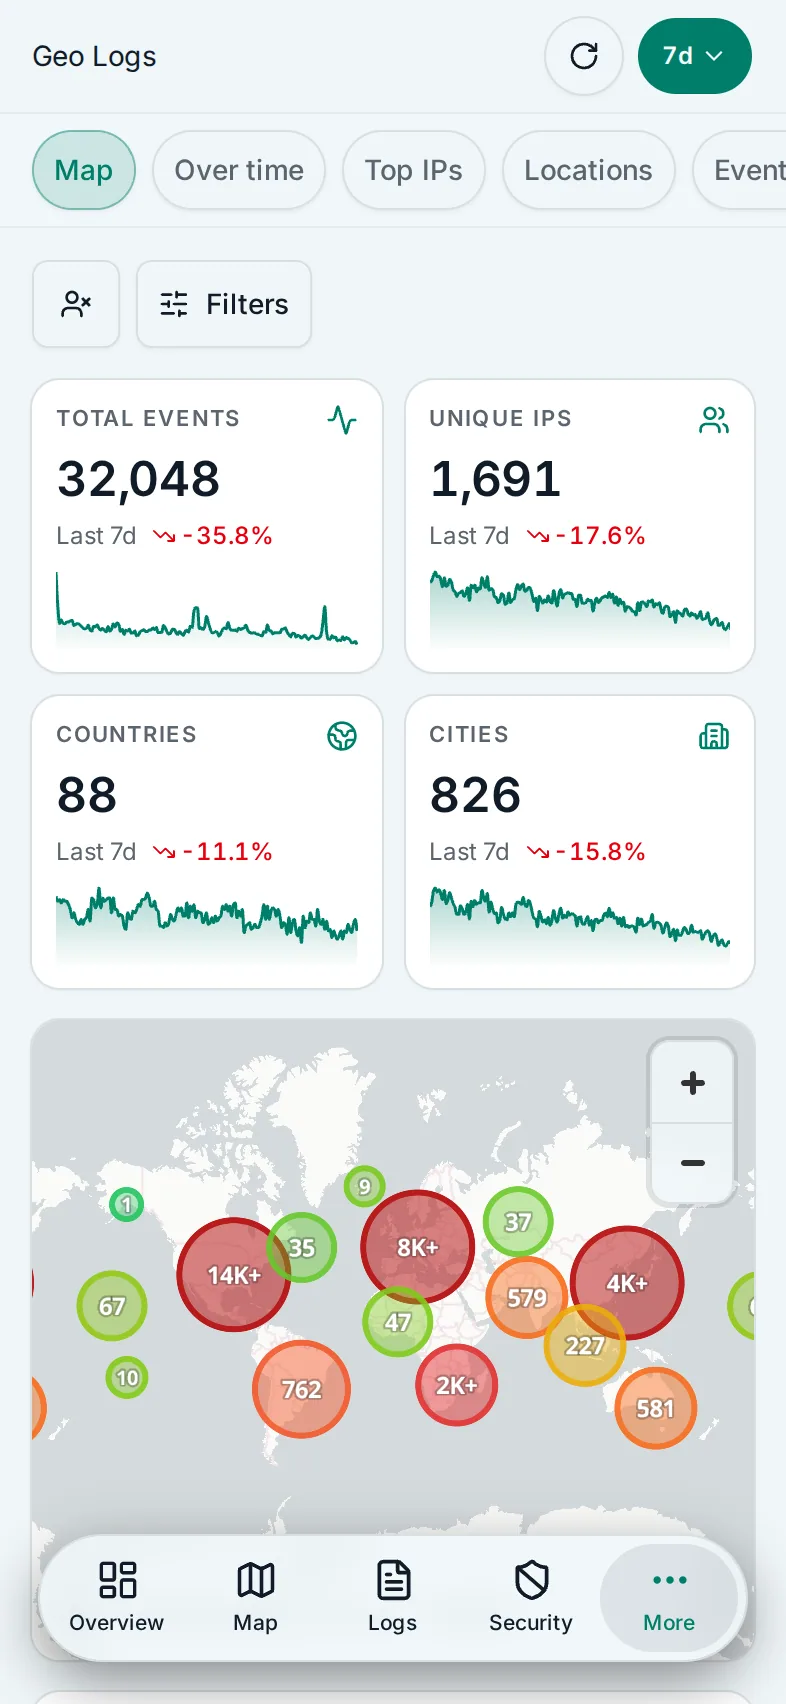
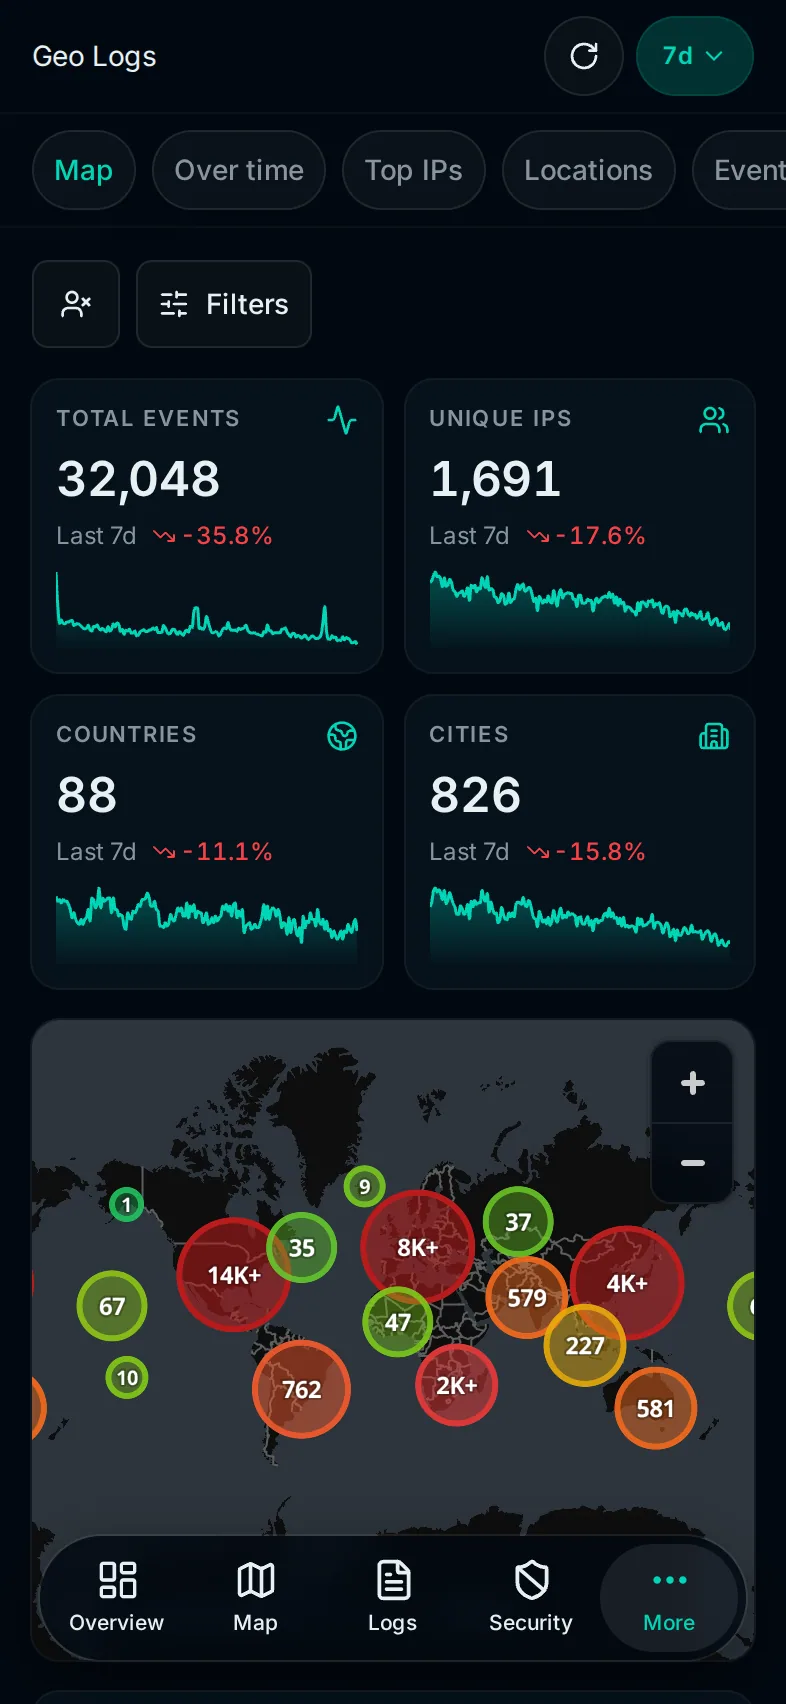
Traffic grouped by location and IP: where requests come from, how that changes over time, and which clients come back. The page has a map preview, cards for total events, unique IPs, countries and cities, an event chart, Top IPs, and Top locations with Countries, Cities and ASNs tabs. The ASNs tab has an abuse report button on each row; see Abuse reports. The table below lists one row per location and IP.
Debug Logs
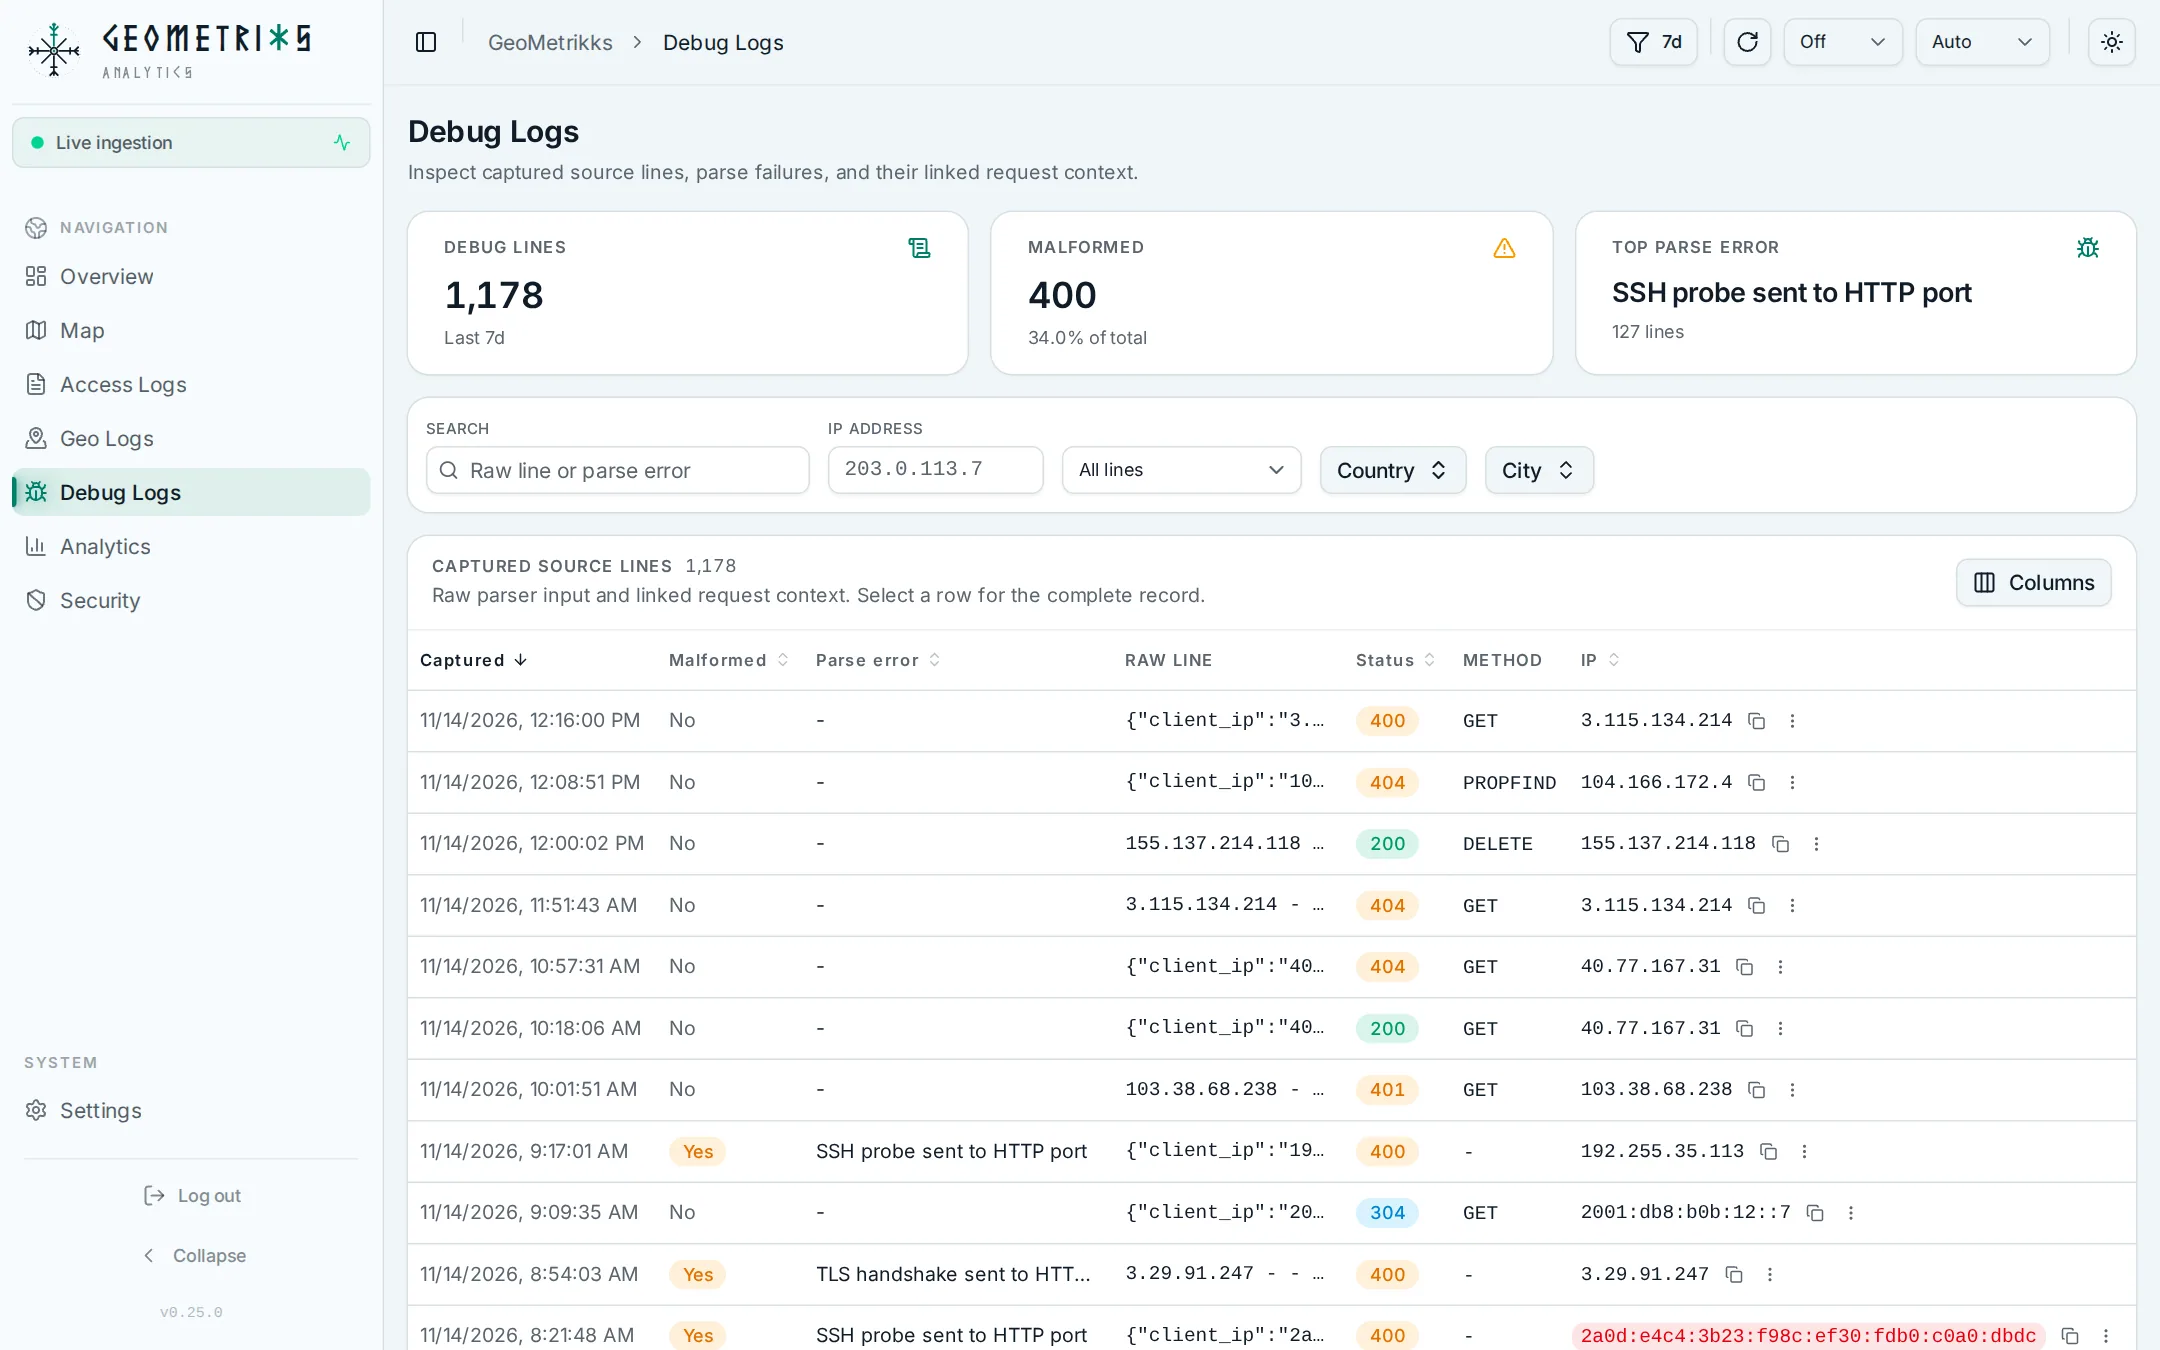
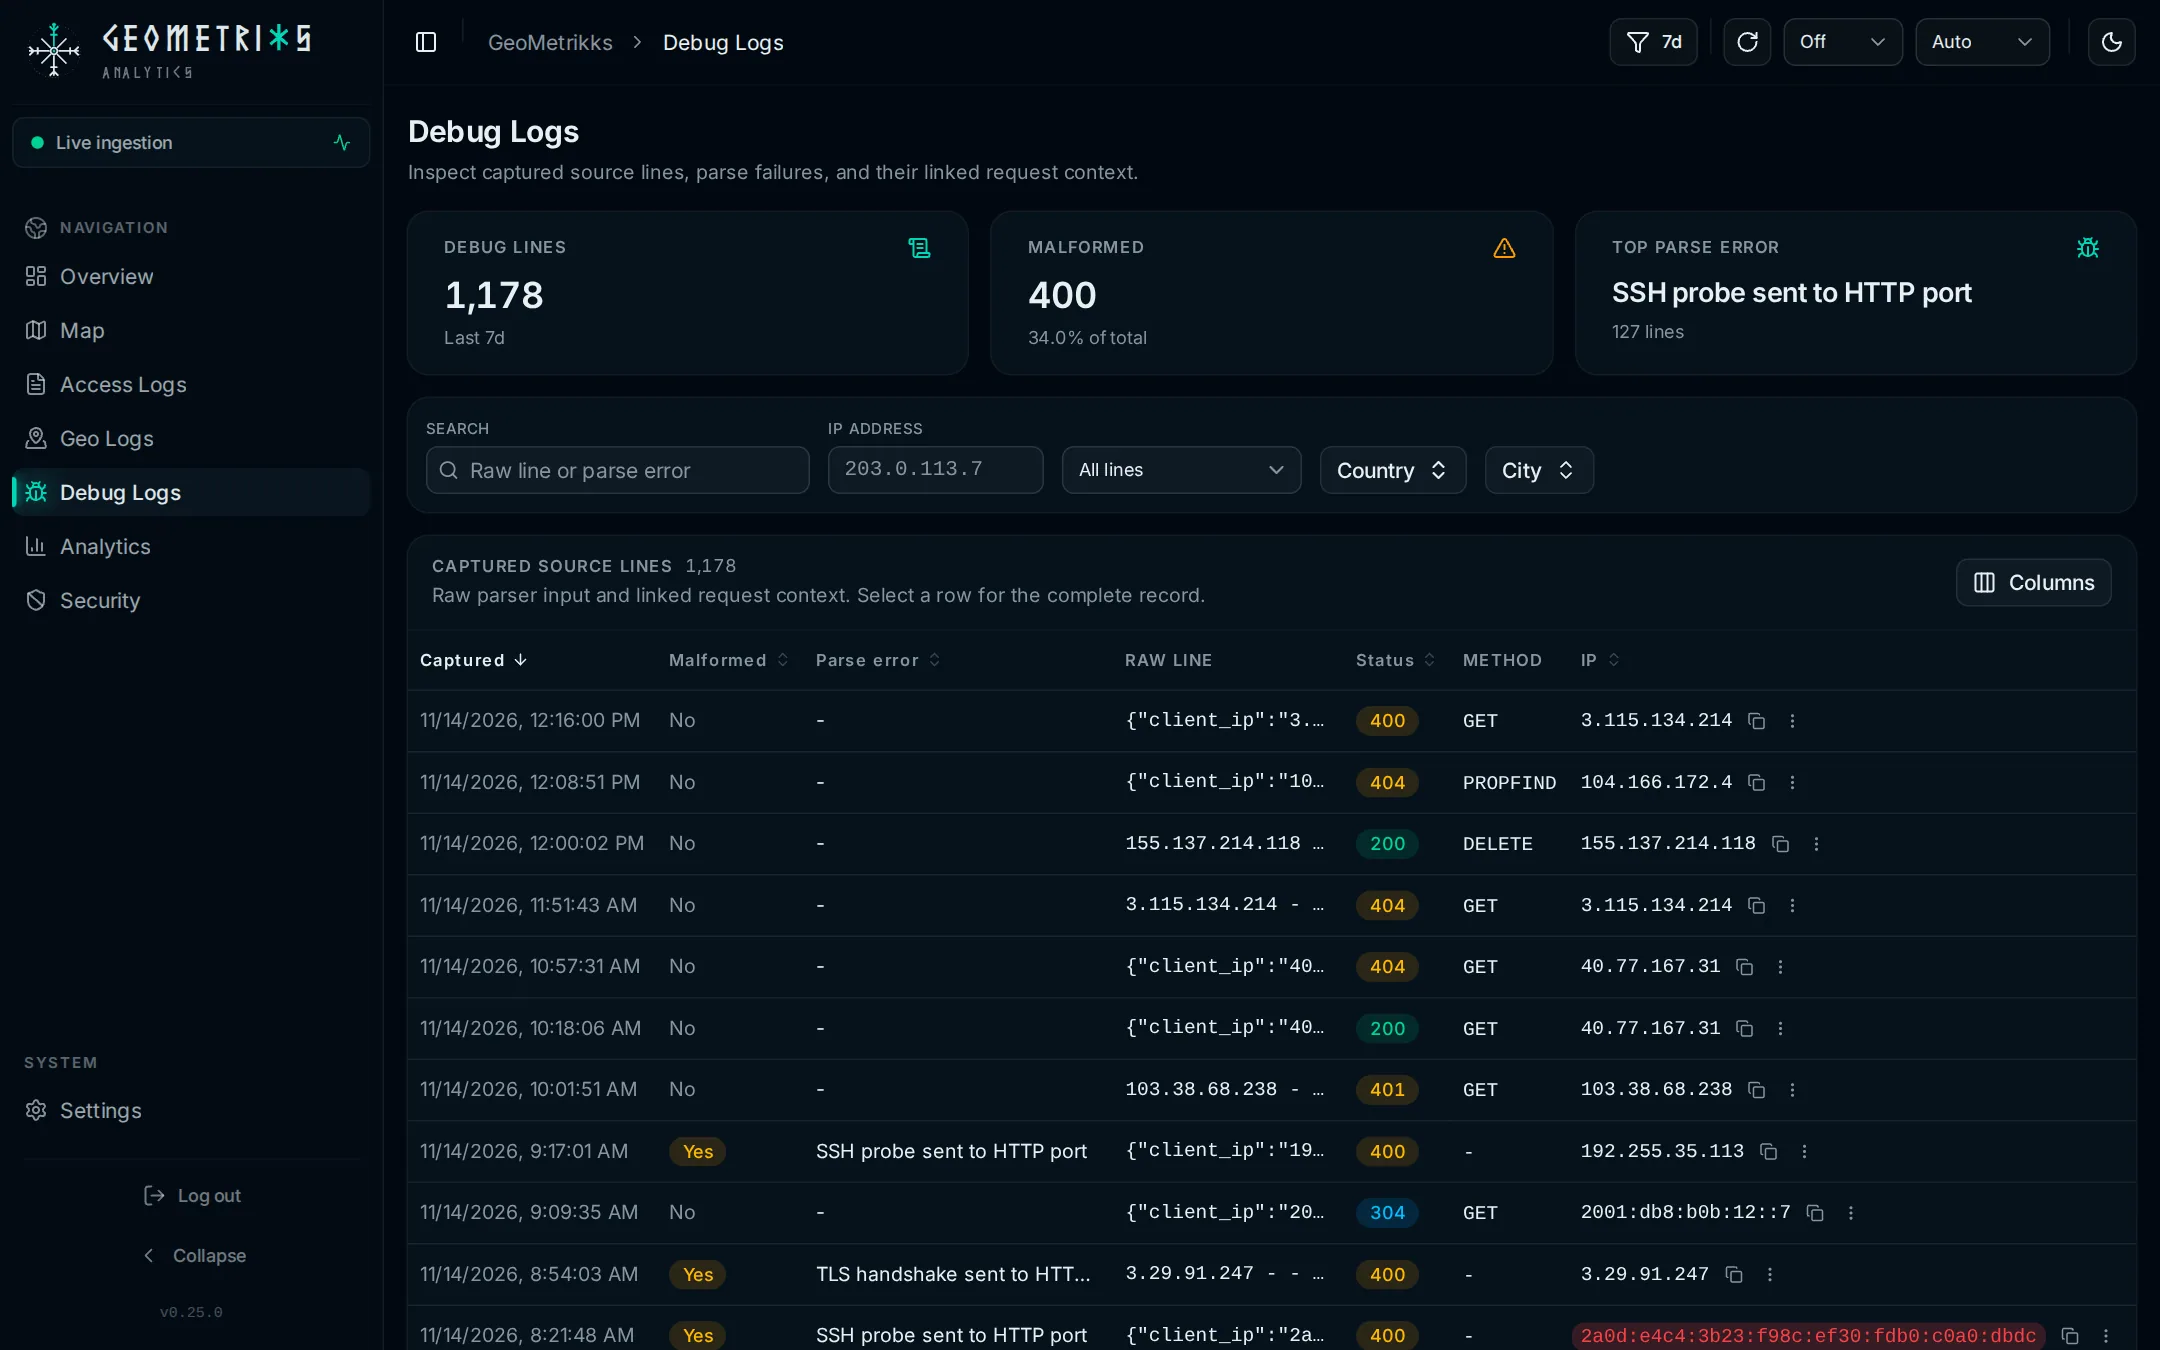
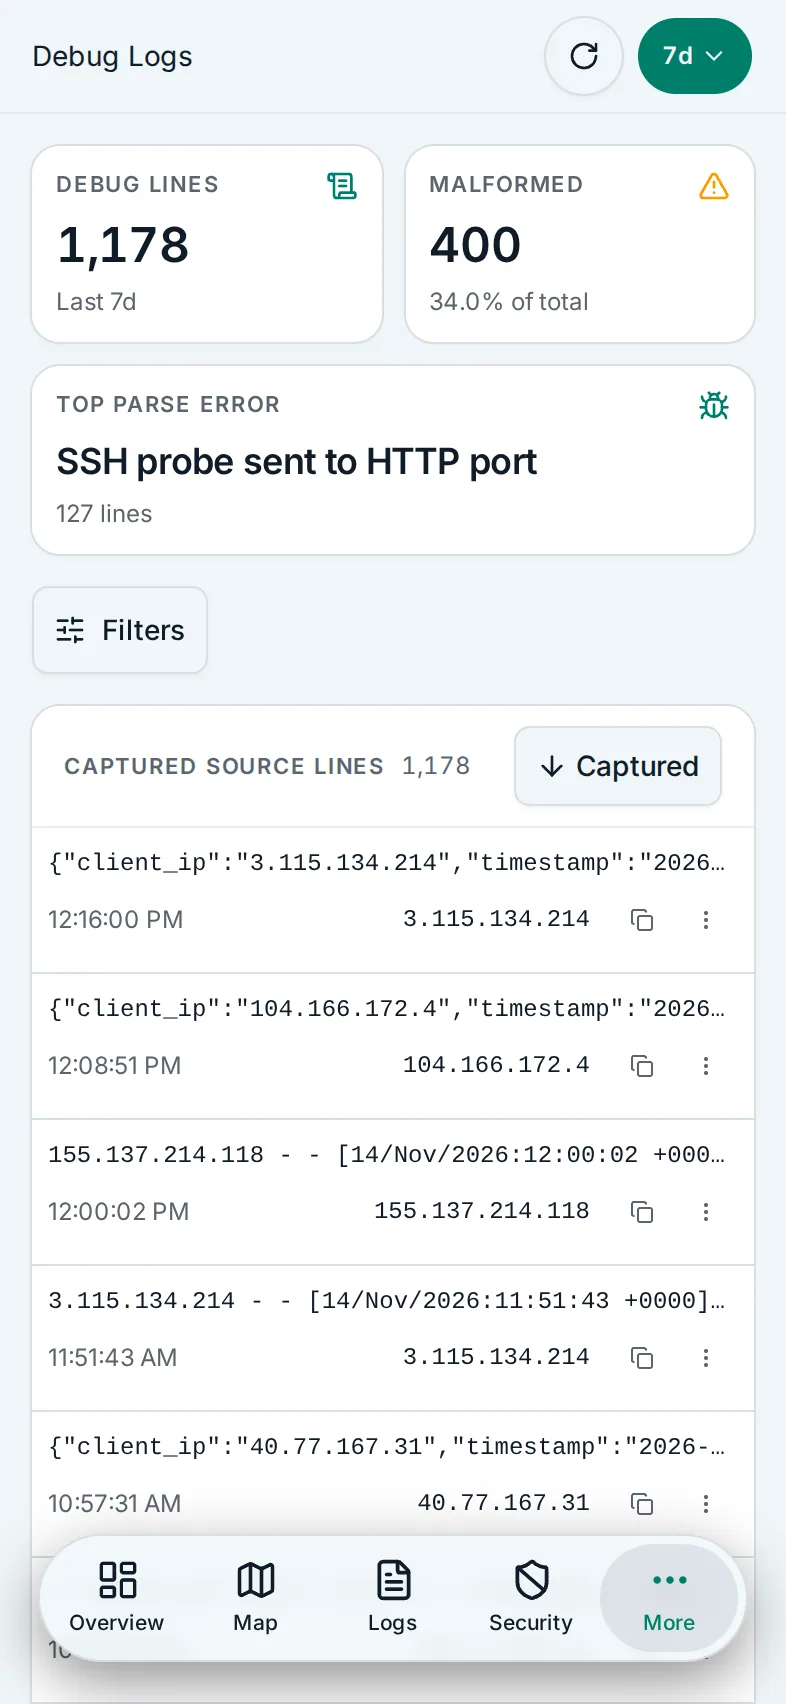
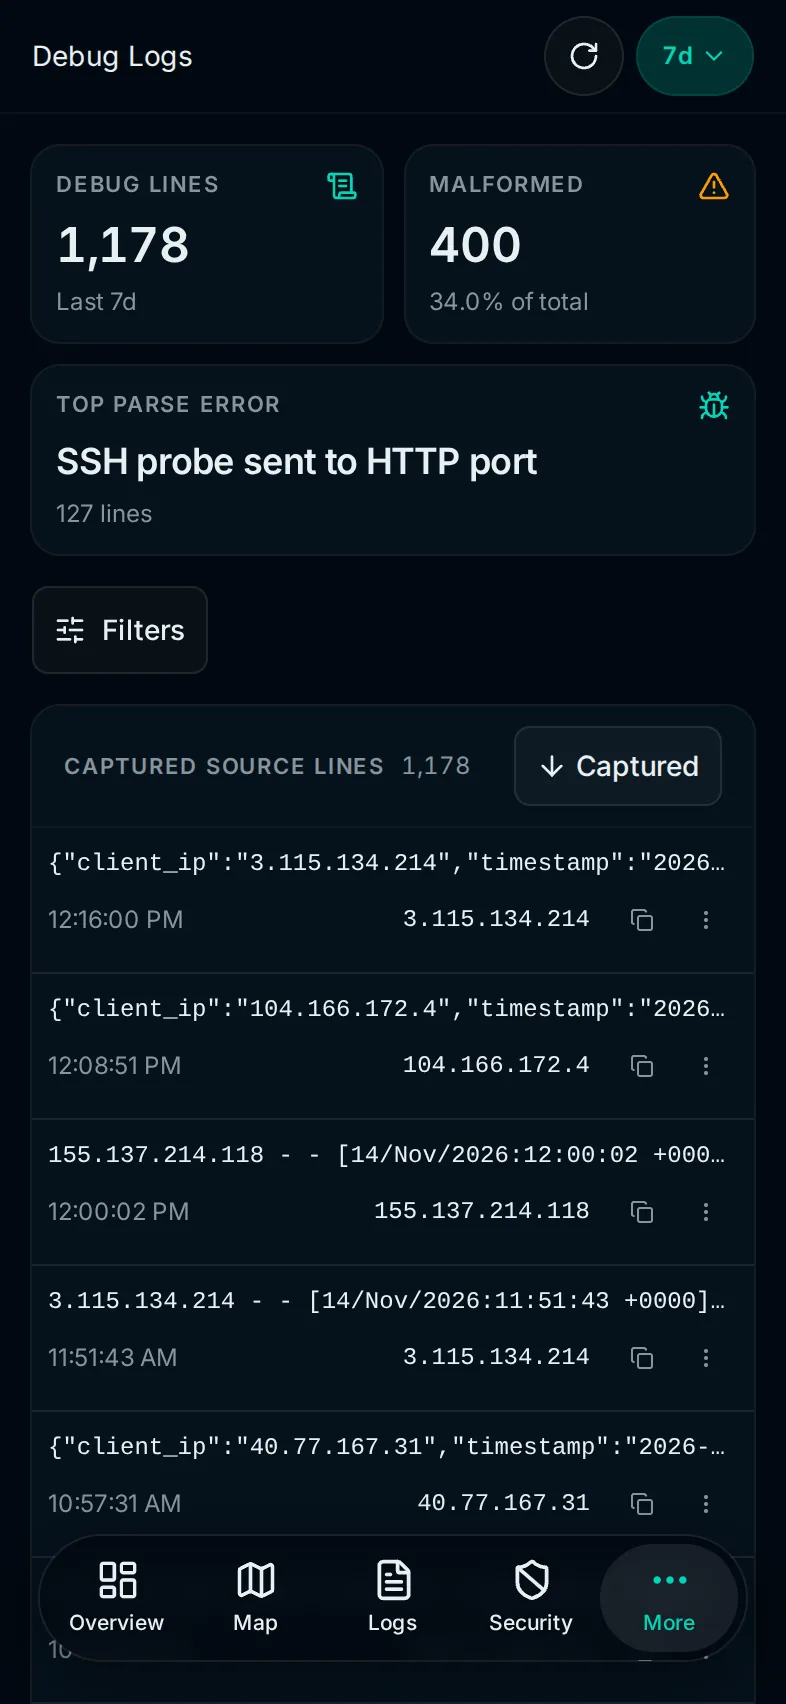
Debug Logs holds the lines the parser could not read and the requests it flags as malformed: a line that doesn't match the log format, a TLS handshake or SSH probe sent to an HTTP port, or a request with no valid HTTP method. Click a row for the raw line and, when there is one, the access-log row it belongs to. This is where to look when a log file produces no events.
With LOGPARSER_STORE_DEBUG_LINES=true the parser stores every line here as well, parsed or not. That grows the database by a row per request, so turn it on only while you chase a parsing problem.
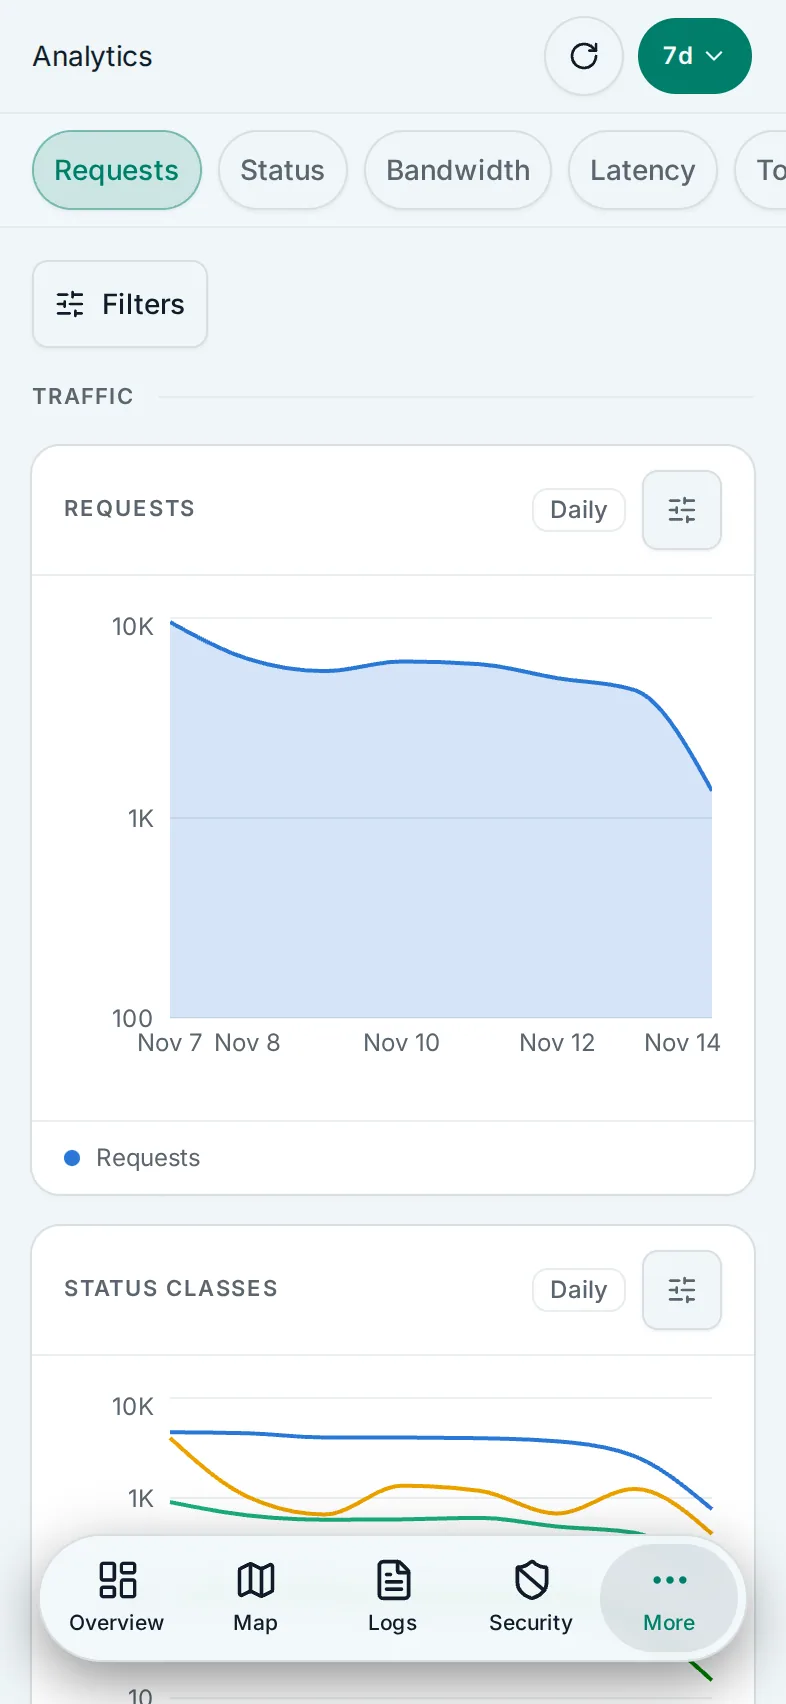
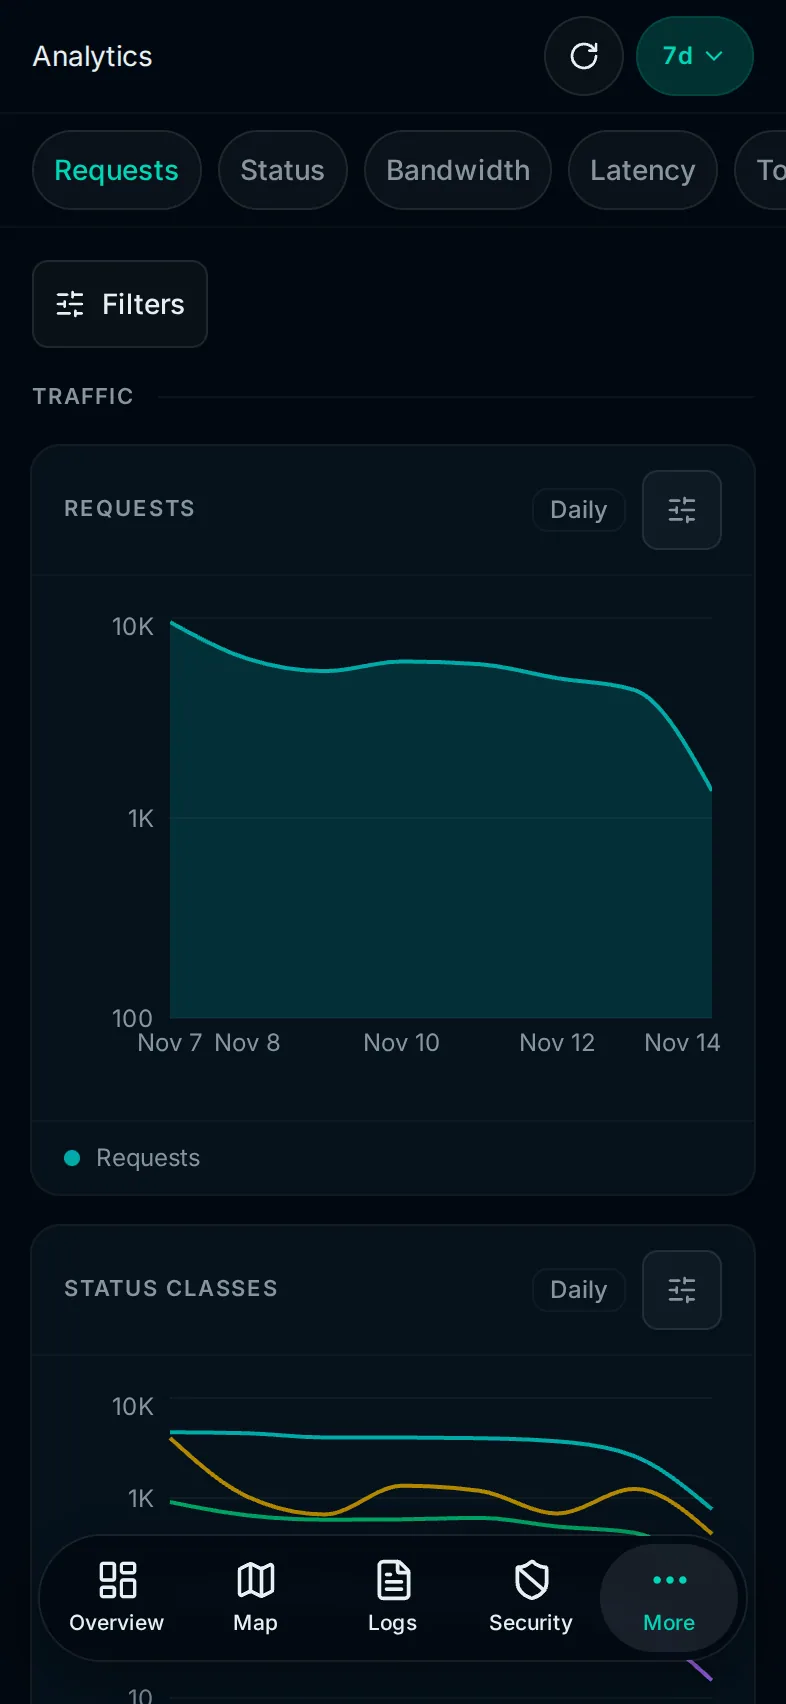
Analytics
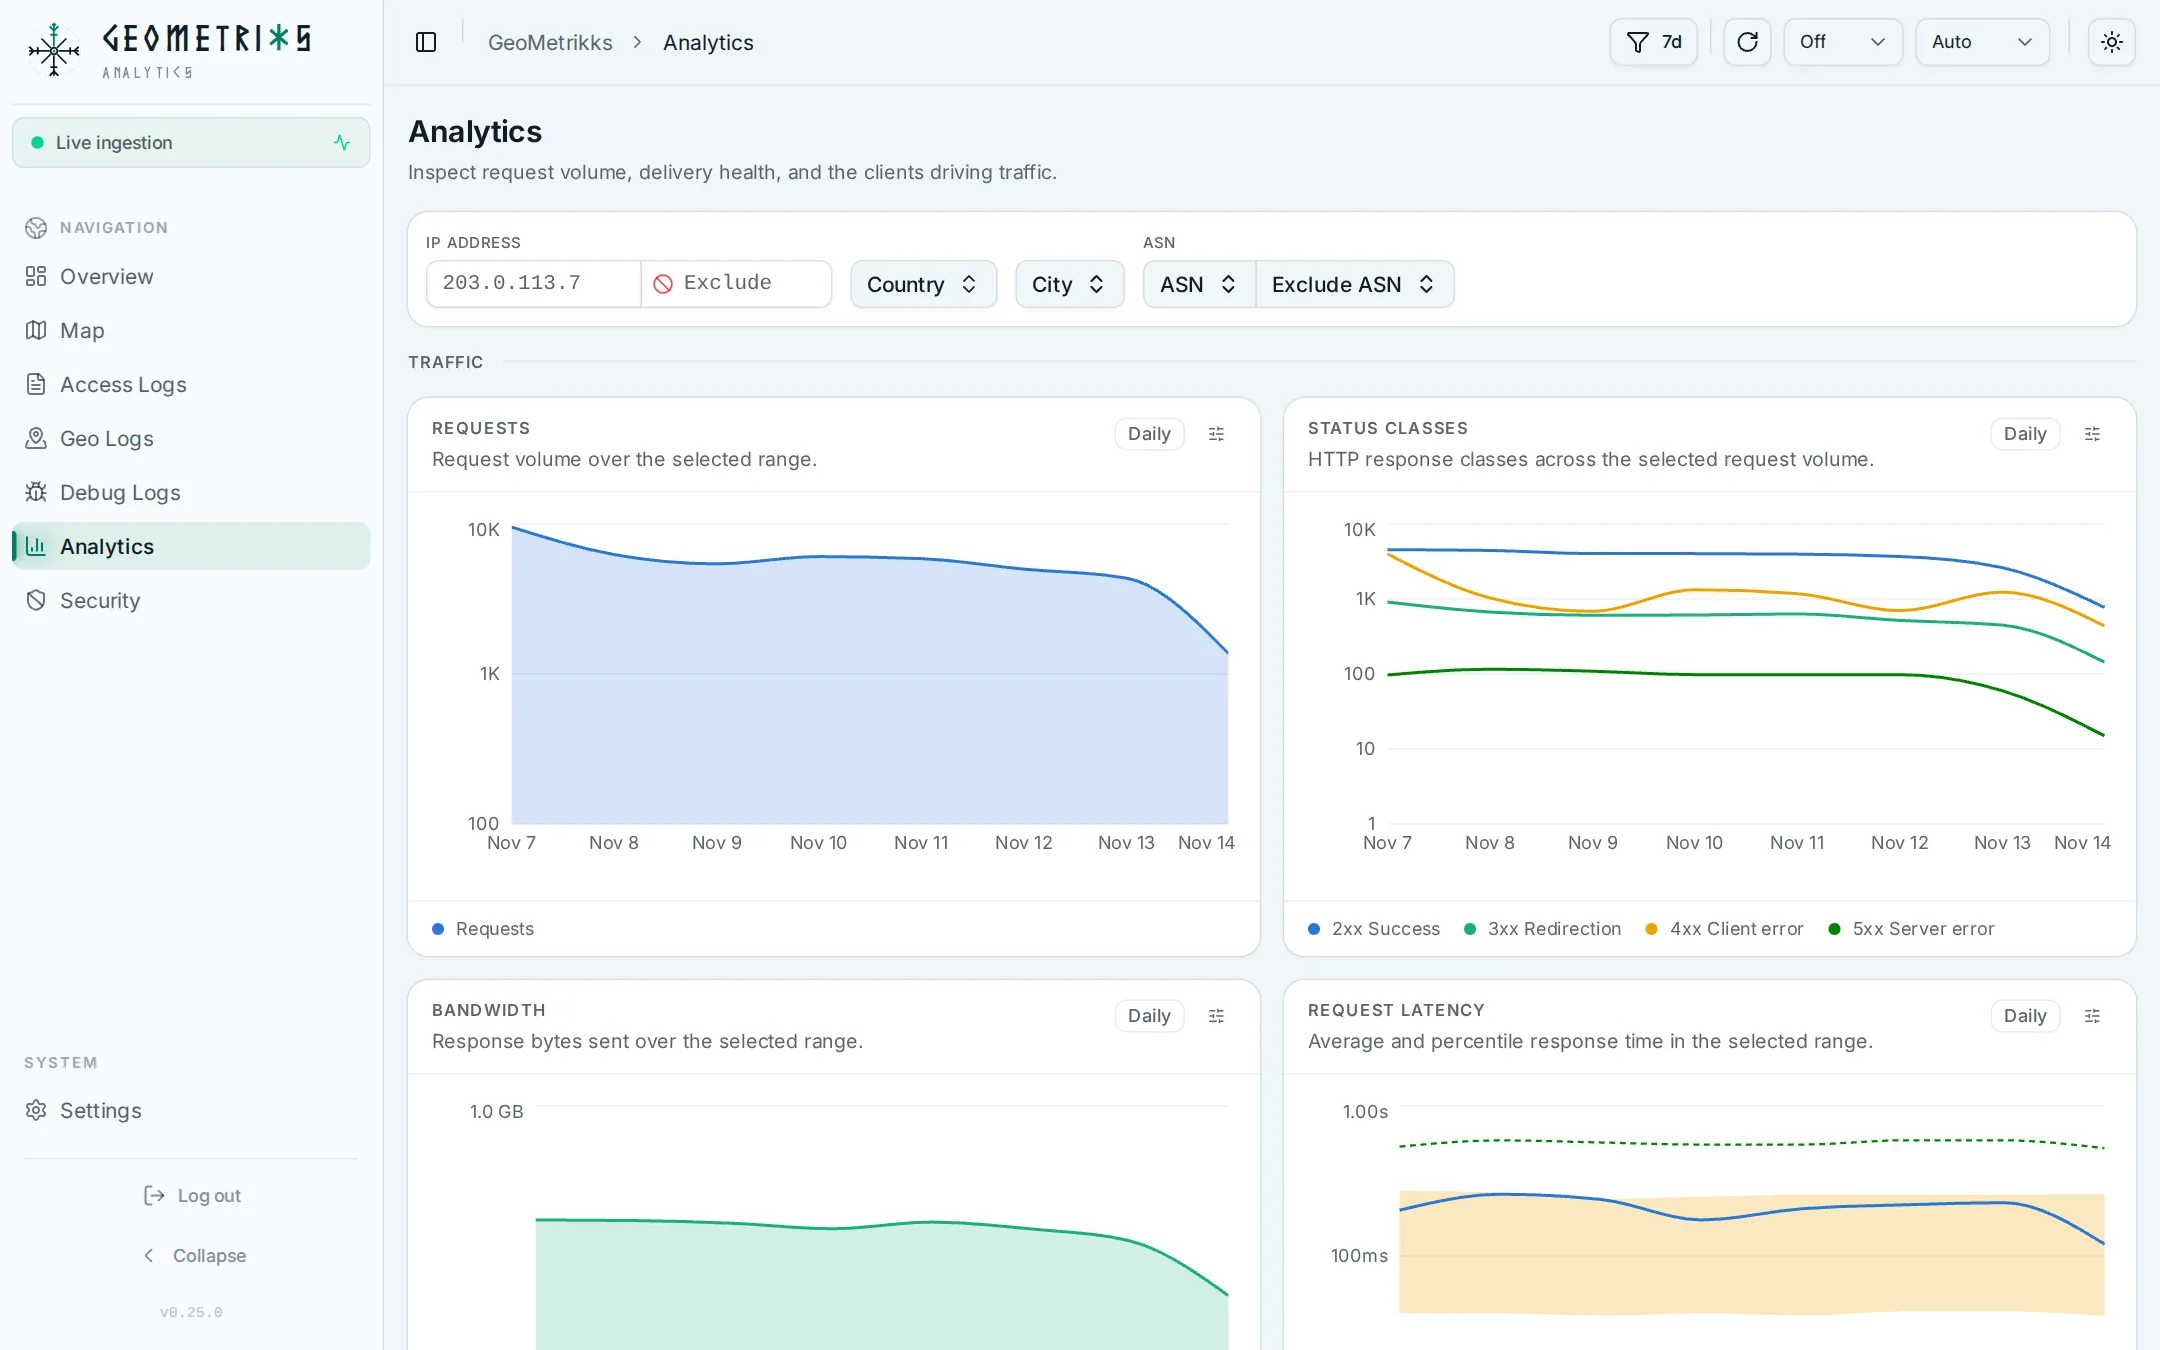
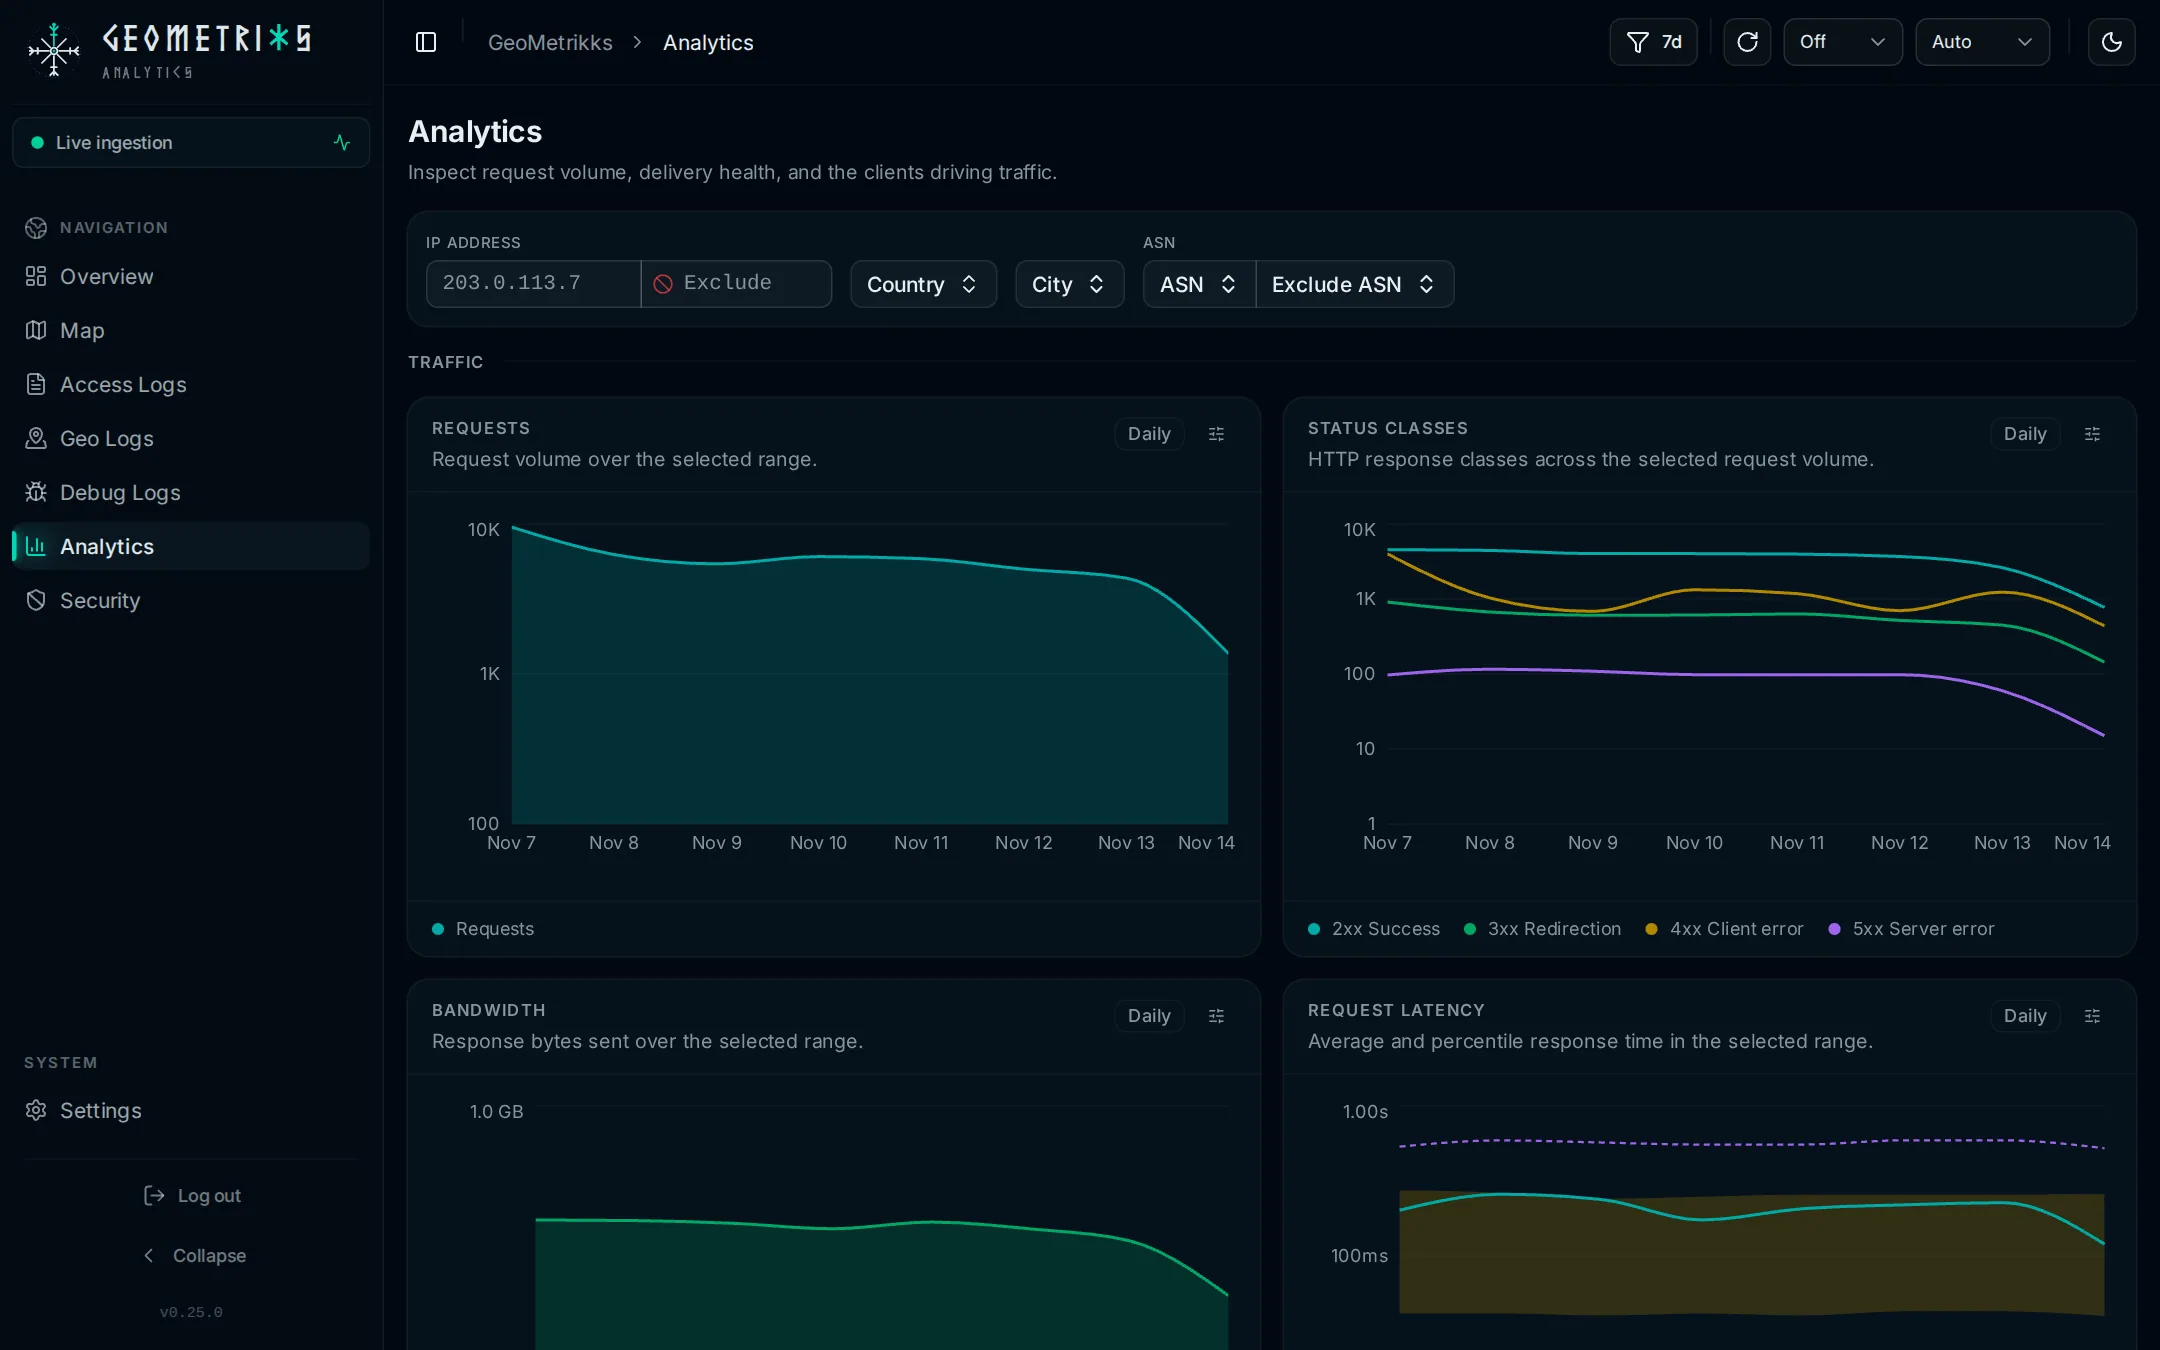
Charts and top lists for the range, all following one filter set: IP address, Exclude IP, country, city, ASN and Exclude ASN.
- Traffic has the Requests, Status classes, Bandwidth and Request latency charts.
- Top Lists has Top IPs, Top Countries / Cities, Top URLs with one row per host and path, and Top user agents.
- Traffic Origin has the hosting and DROP split and Top ASNs. Each Top ASNs row has an abuse report button.
Request latency and the other response-time figures leave out status 101 and status 0. Under 101, nginx and Traefik log a WebSocket's whole connection time, and 0 means the connection ended before any response, so neither time is a response time. Those rows stay in Access Logs with the time the proxy logged.
Security
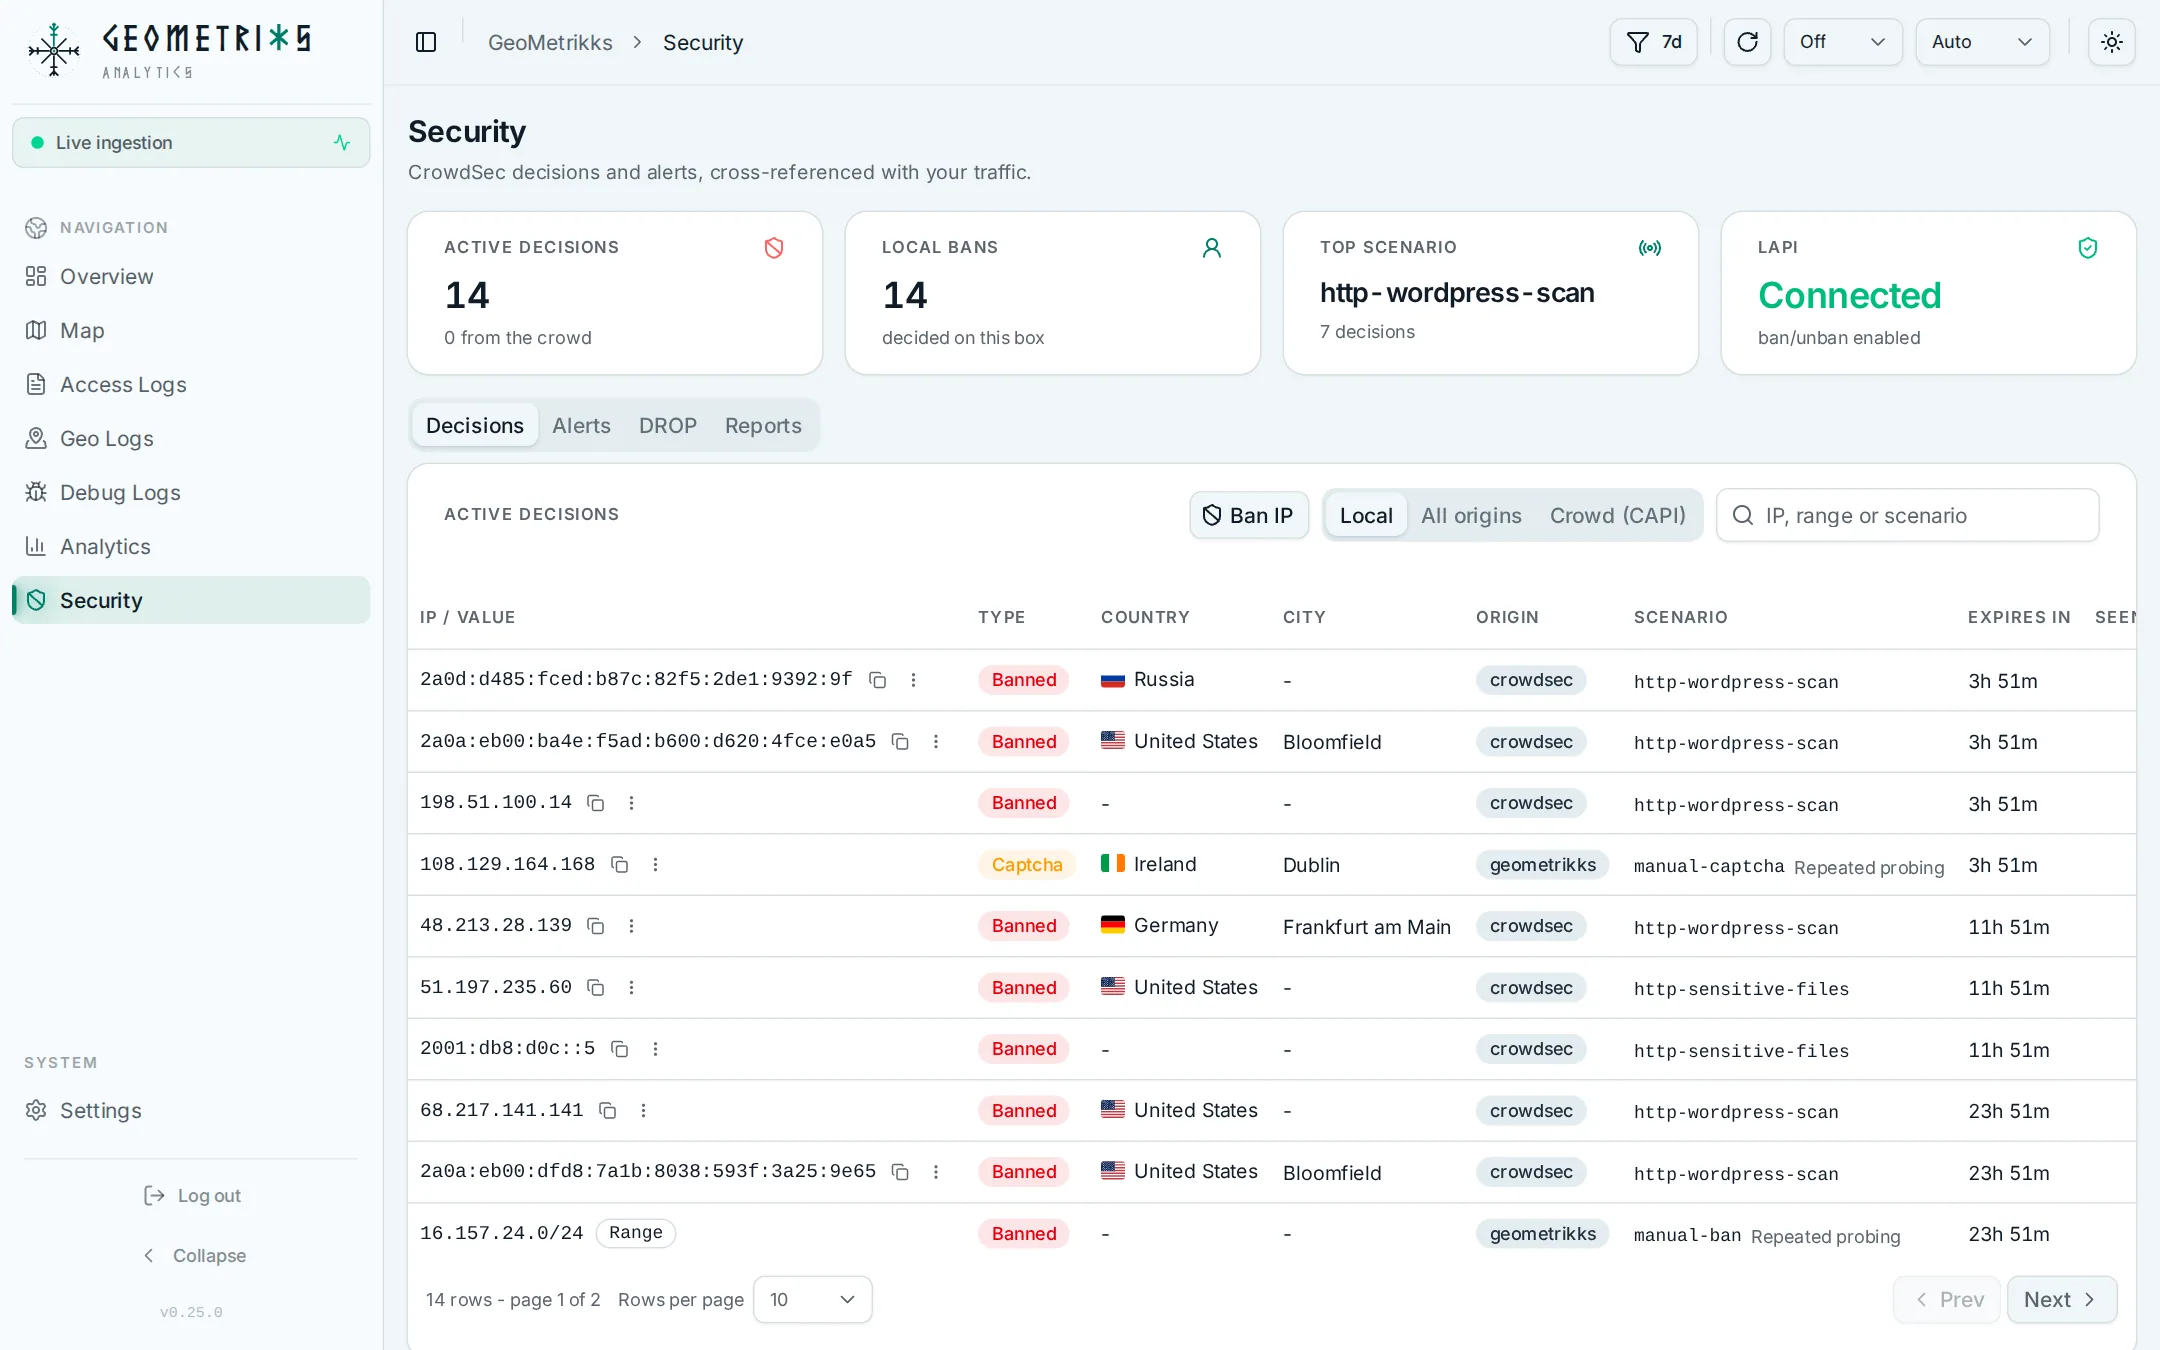
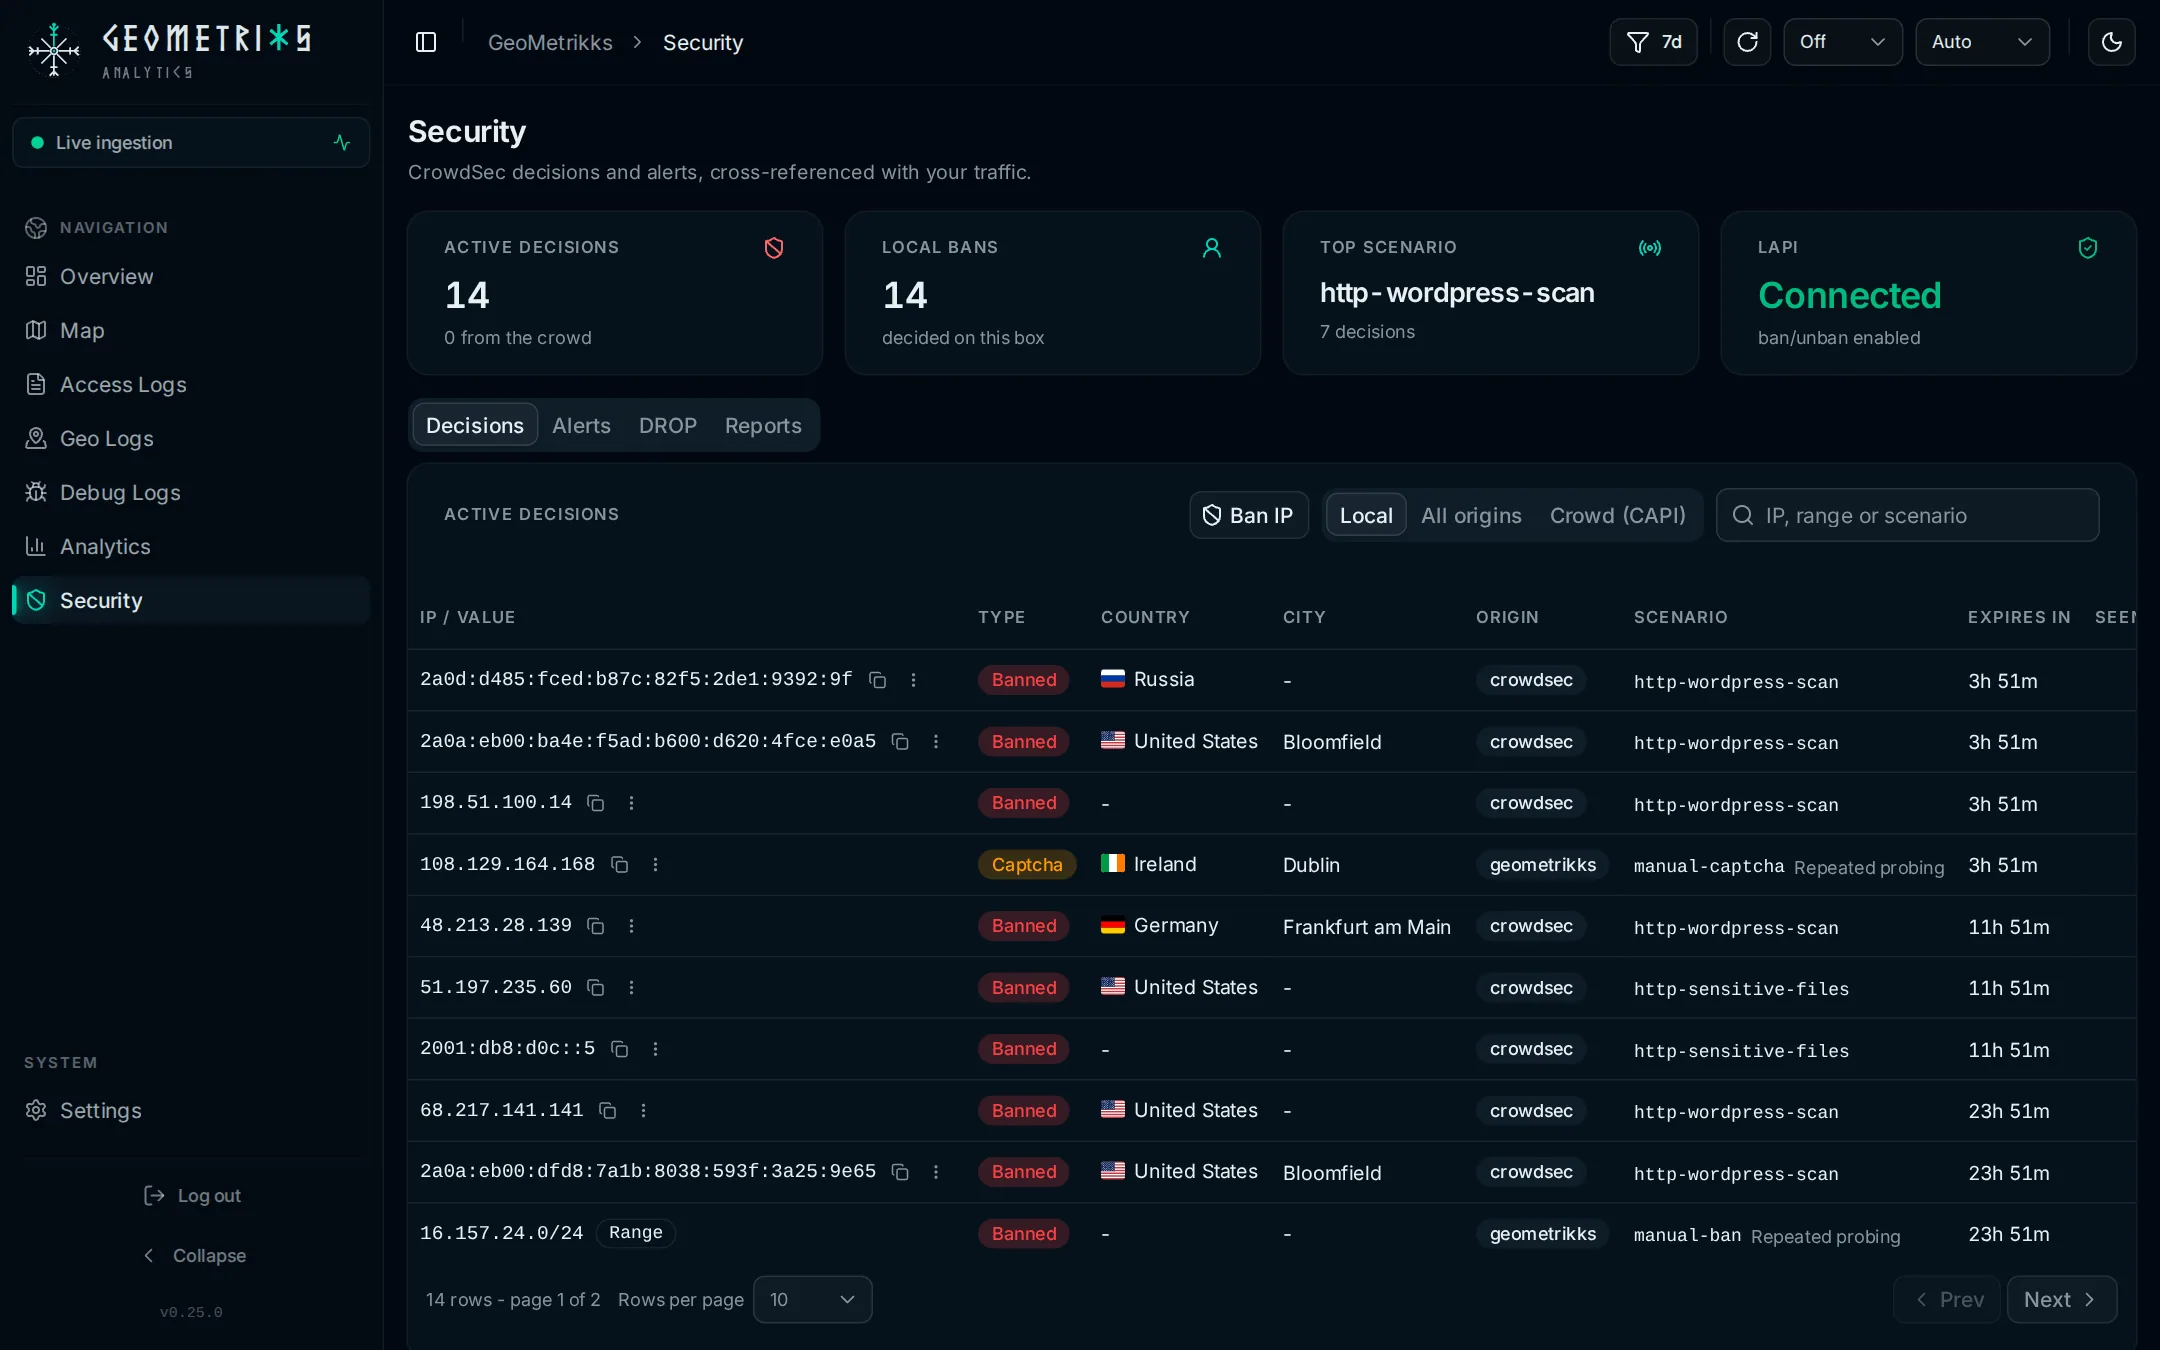
CrowdSec decisions and alerts sit next to your own traffic, so you see who is banned and whether they are still sending requests. Stat cards sit at the top, and below them the page shows one table at a time in the Decisions, Alerts, DROP and Reports tabs. Alerts needs CrowdSec machine credentials, and DROP appears once the DROP lists have downloaded. Reports lists what GeoMetrikks has sent to AbuseIPDB and appears with AbuseIPDB reporting on. The open tab is in the URL, so a reload or a shared link keeps it.
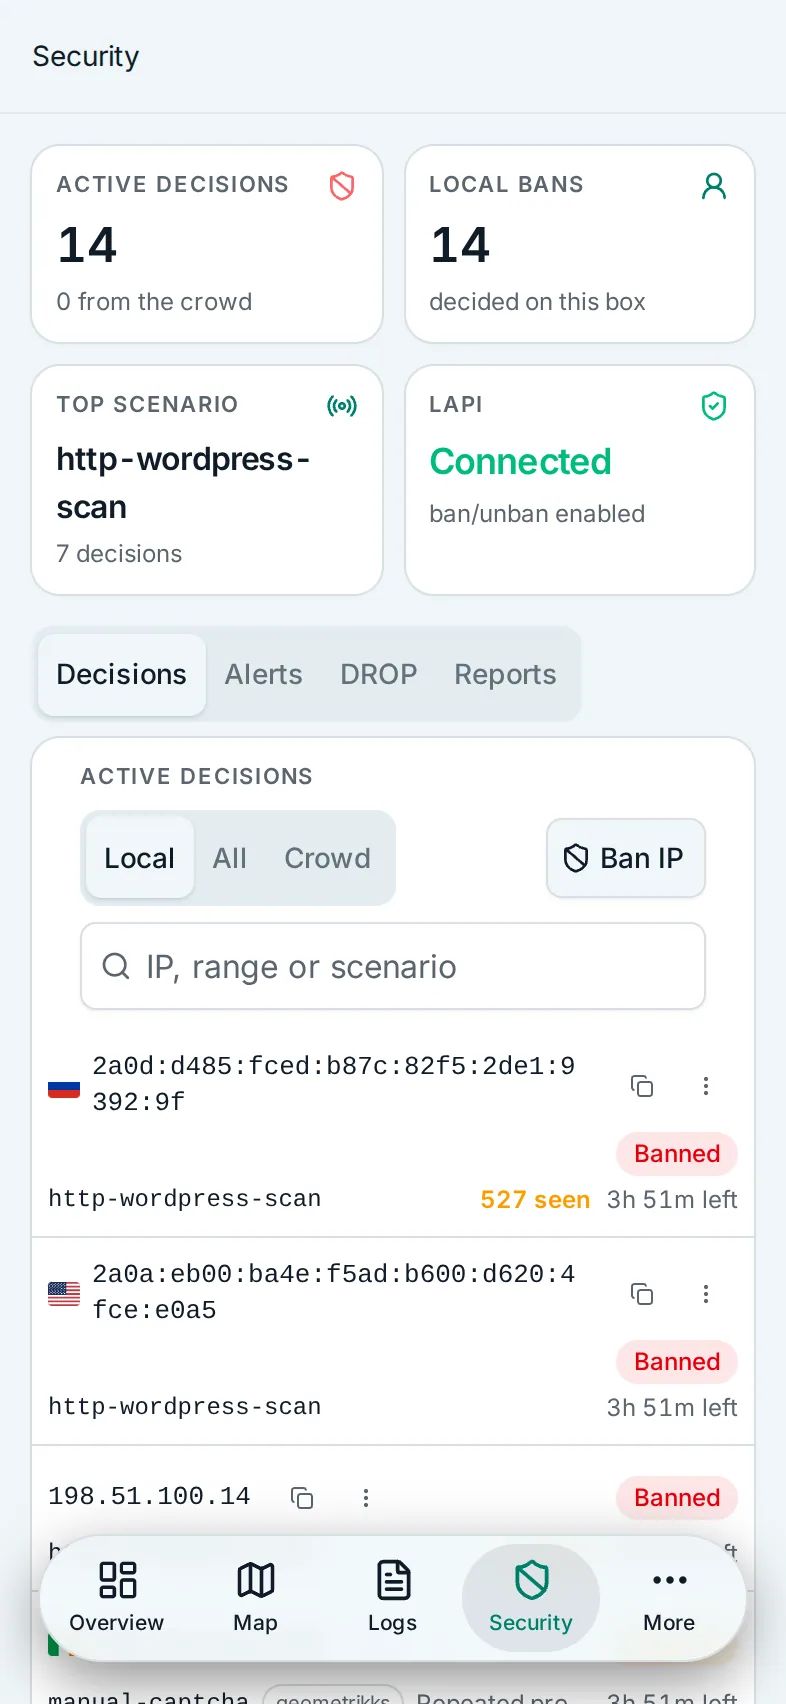
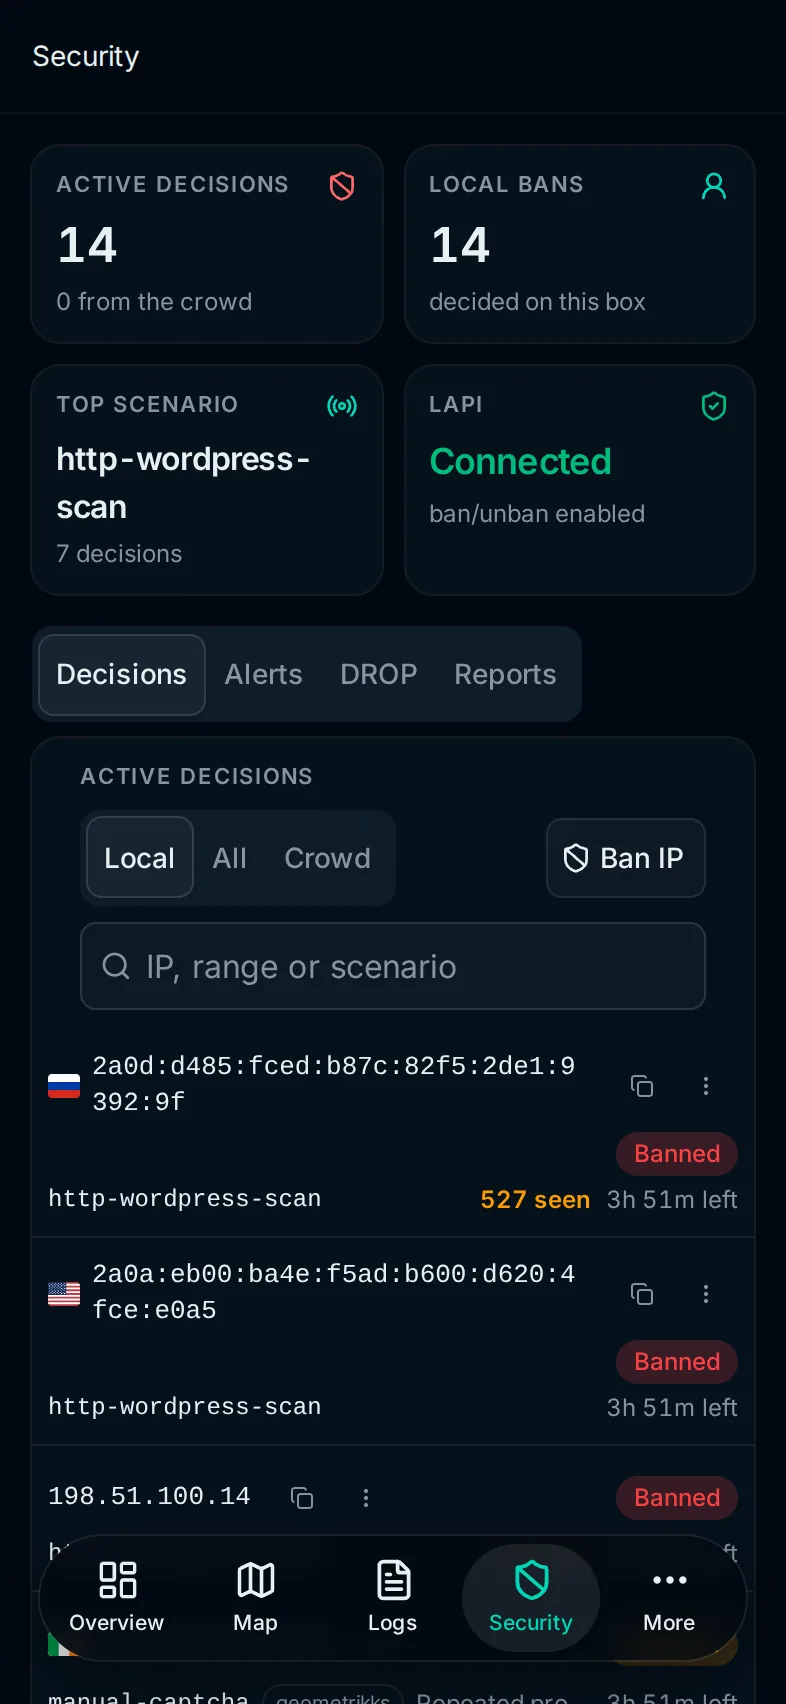
With AbuseIPDB reporting on and CrowdSec not set up, the page shows only Reports. With neither, it says how to connect CrowdSec. CrowdSec covers the setup, the ban actions and each tab. The DROP tab is described under Spamhaus DROP lists, and Reports under AbuseIPDB.
Settings
Status
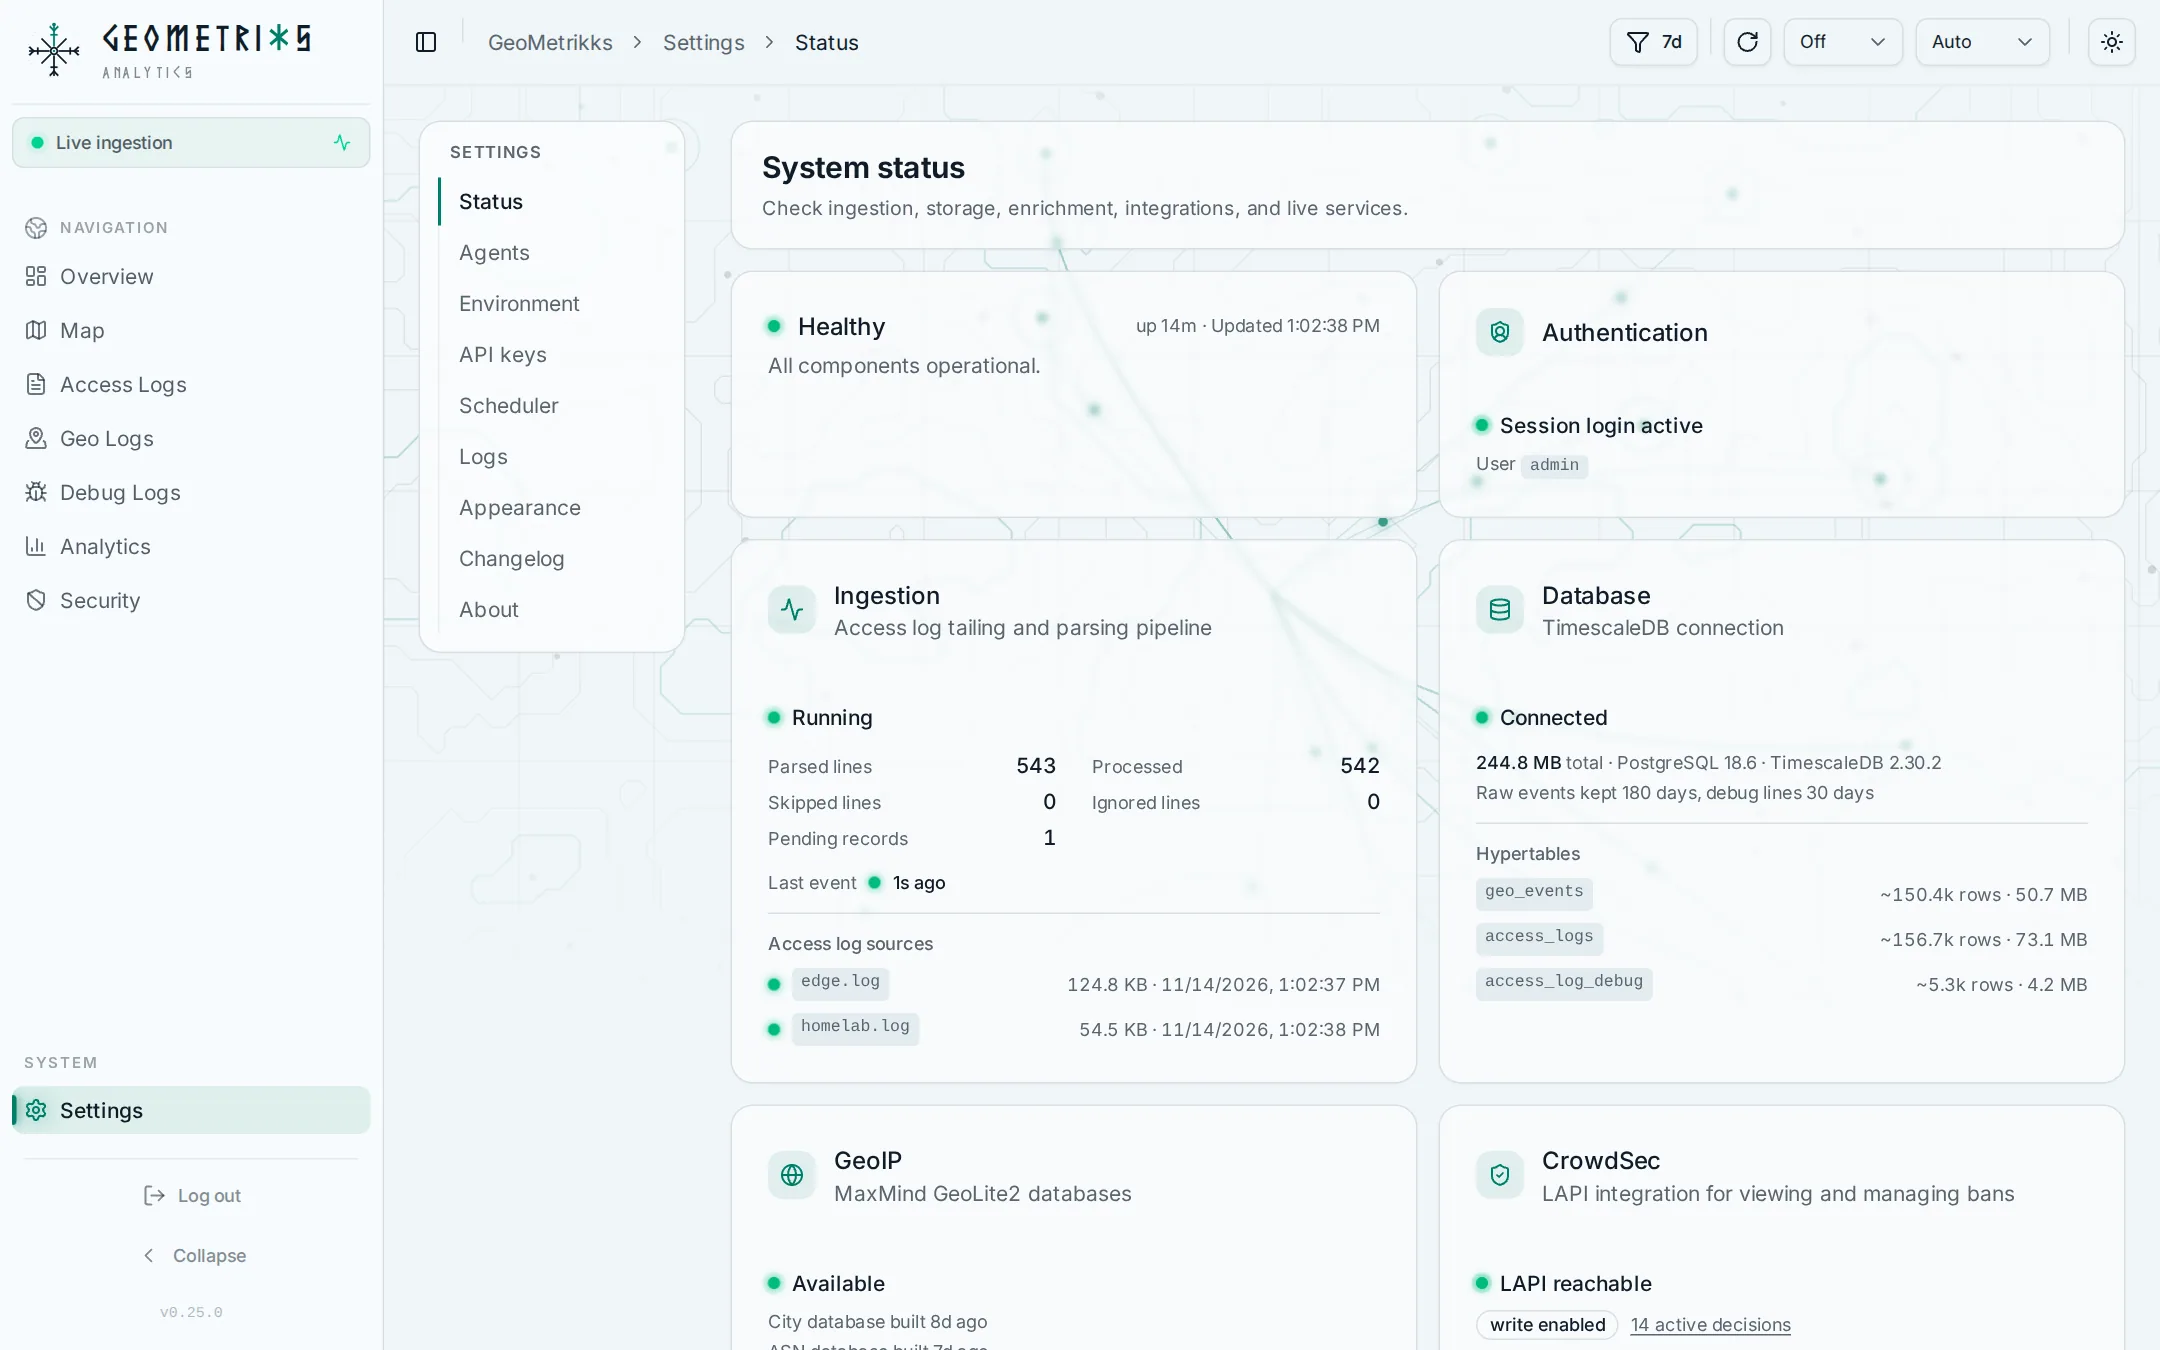
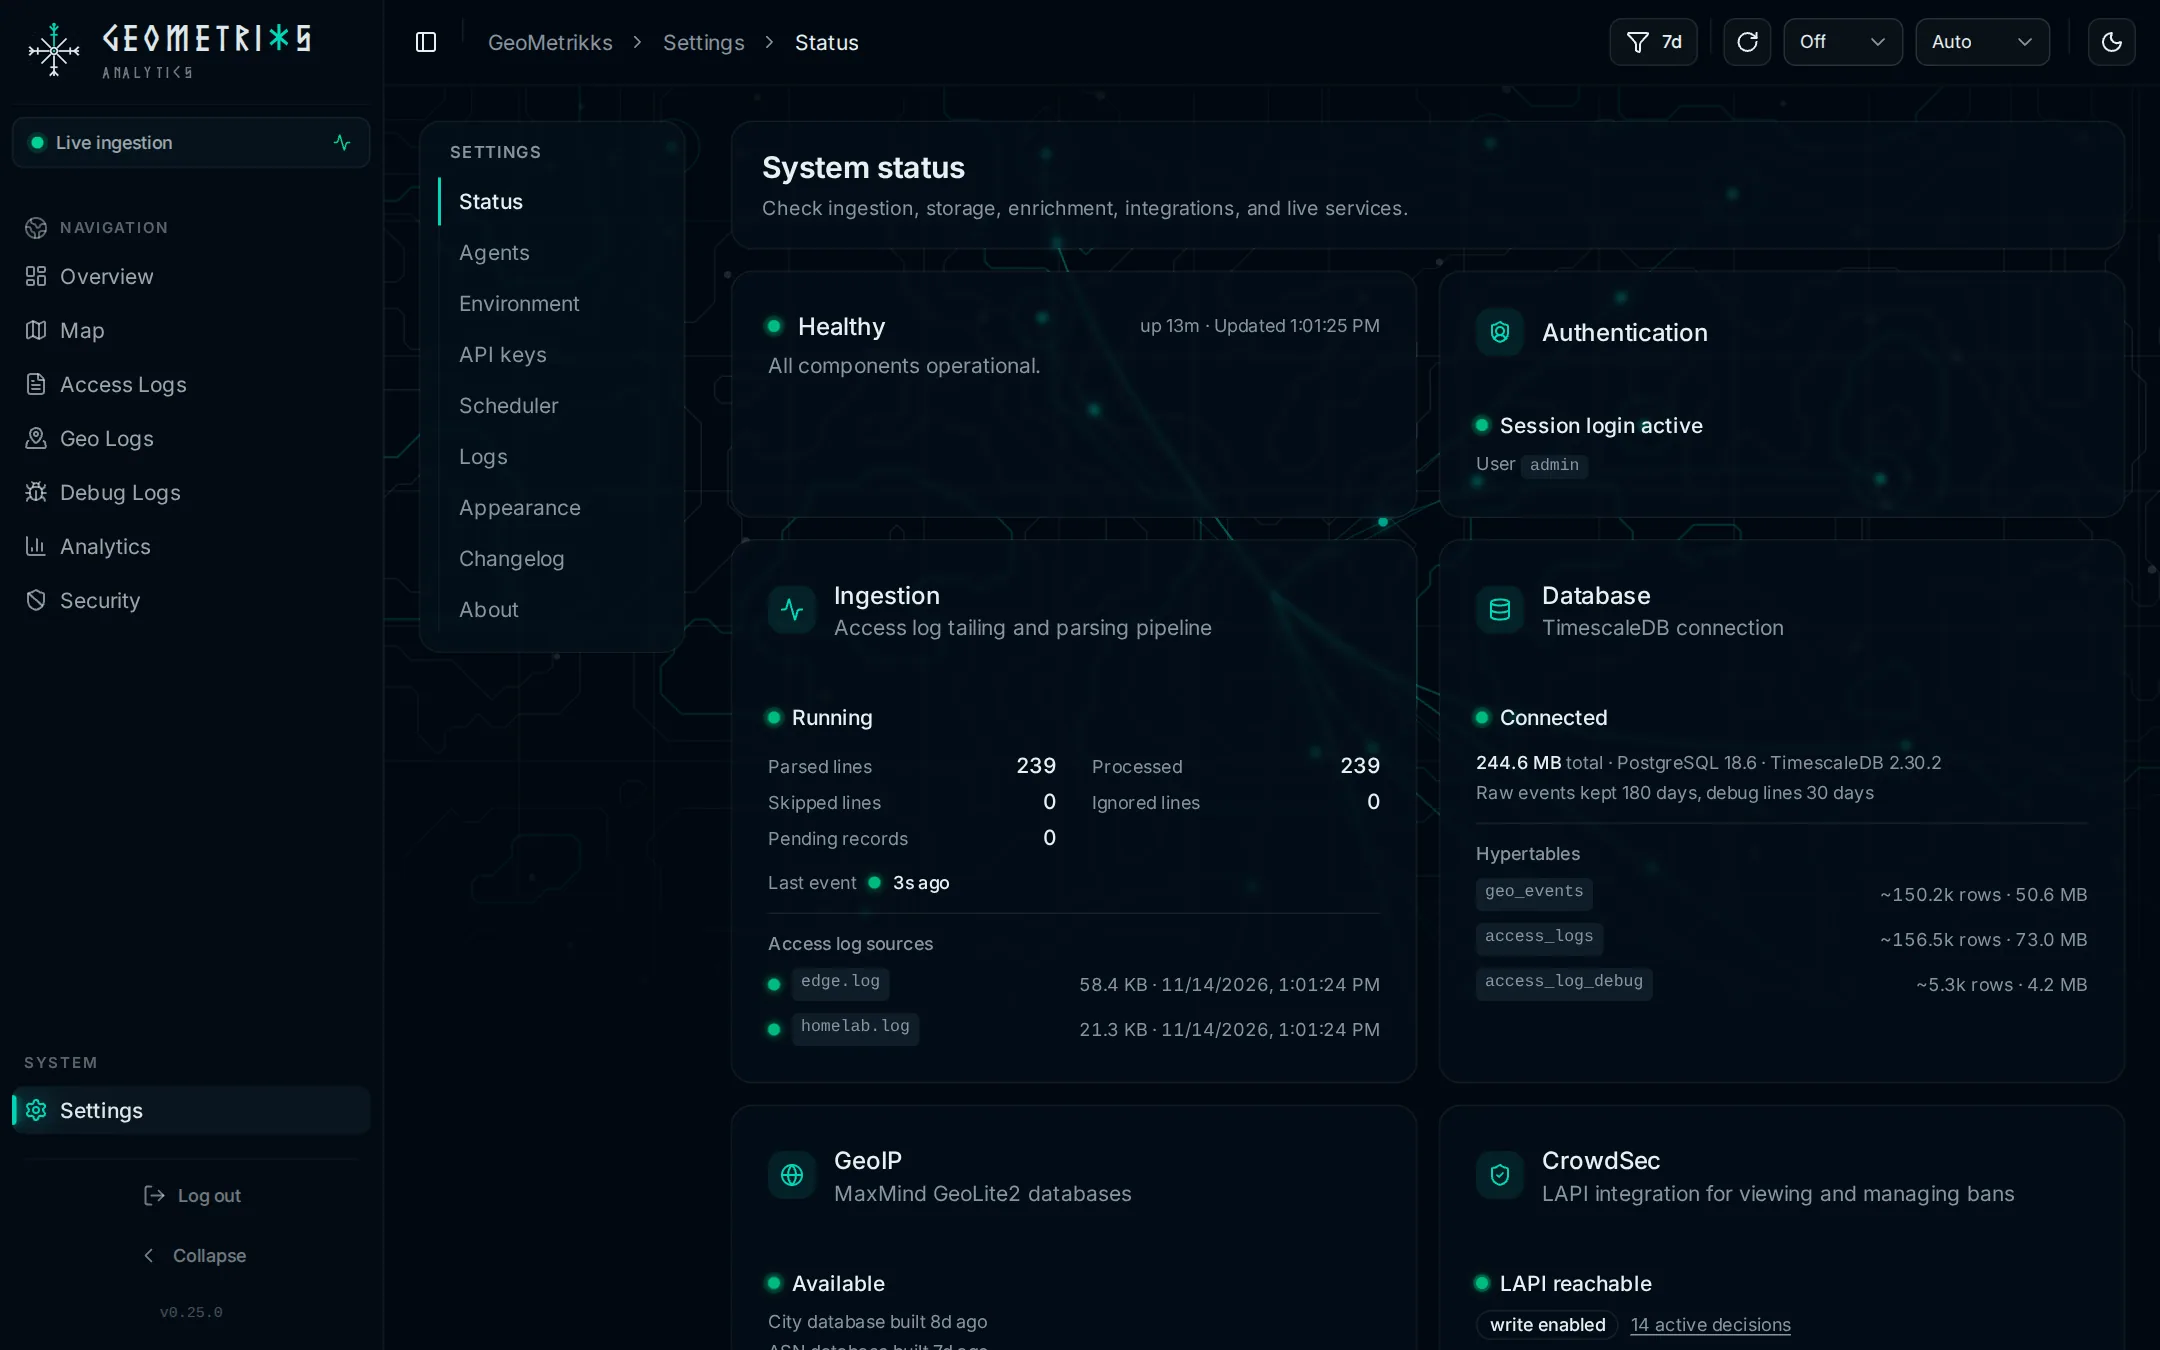
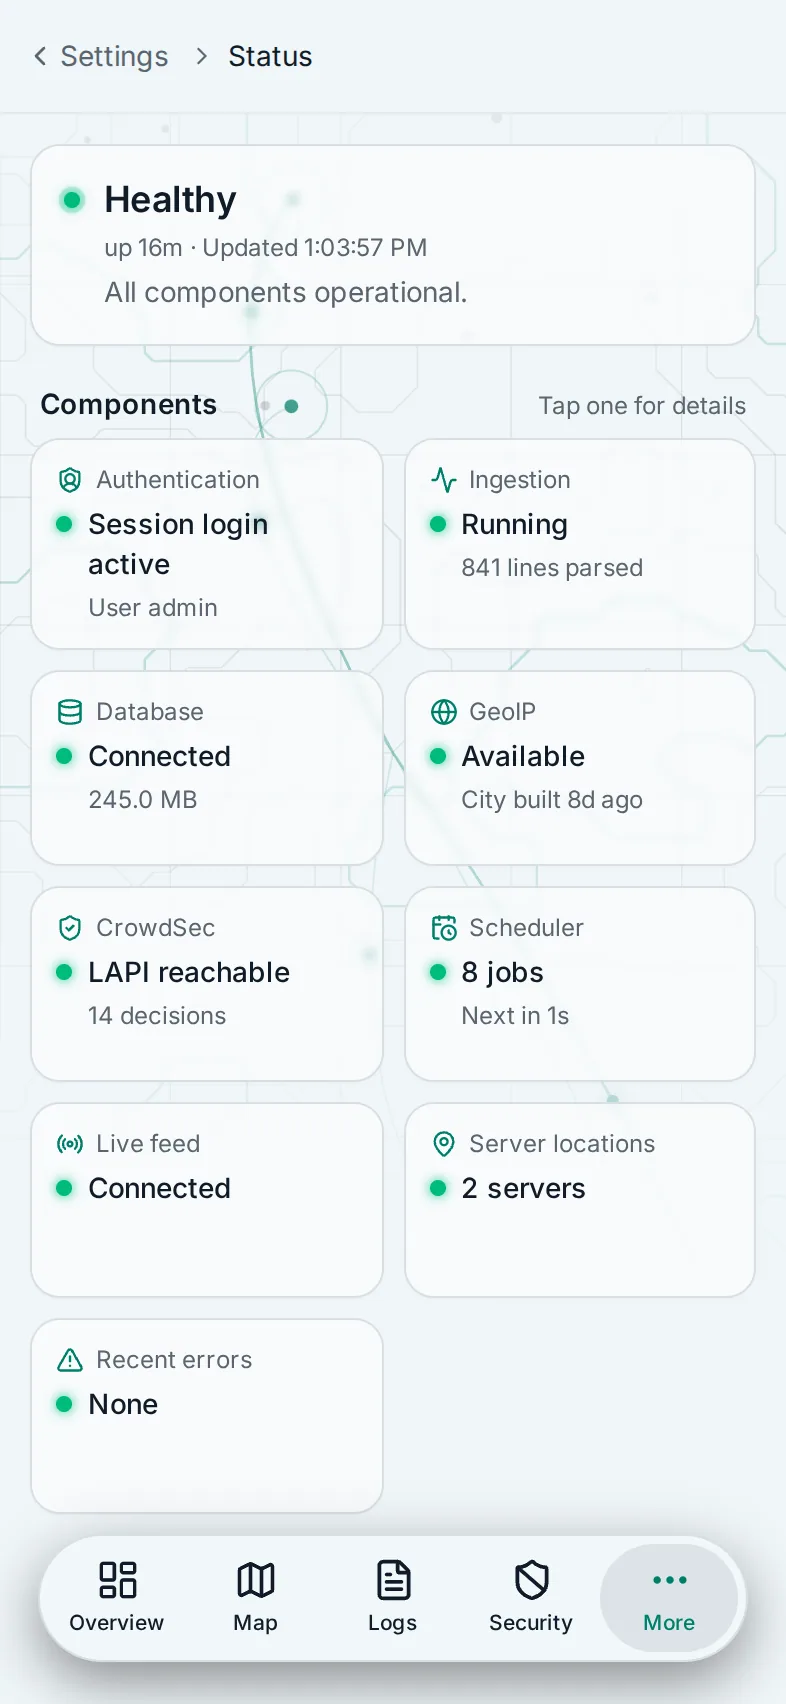
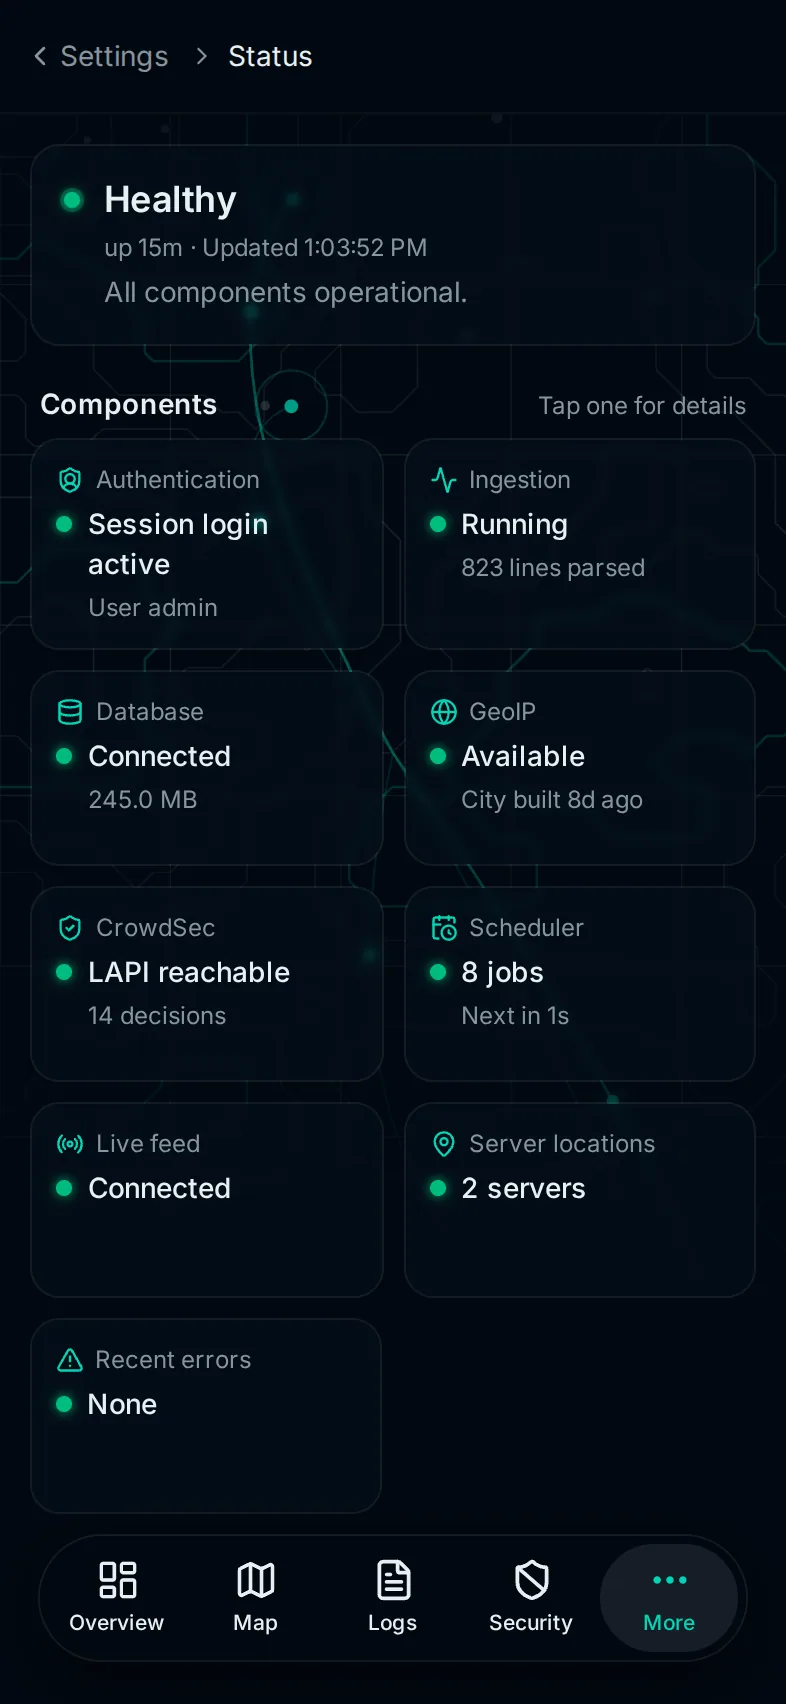
Status shows the health of the whole app on one page, with a card each for Authentication, Ingestion, Database, GeoIP, CrowdSec, Scheduler, Live feed and Recent errors. An Agents card joins them once agents write to the database, and a Server locations card once a server has a location. Advisories at the top say when something needs attention, such as a missing ASN database or a server whose location could not be detected.
Agents
Every instance that writes to this database, the full instance first, with its version, server names, recent line counts and last check-in. An agent that stops checking in is flagged. See Settings > Agents.
Environment
The settings the app resolved at startup, with the ones your environment overrides marked. Secret values stay hidden. The configuration reference explains each one.
API keys
Keys for scripts, monitors and dashboards. A key is Read or Read/write, and a Read key gets a 403 on anything that changes data. Browser logins don't use keys. API keys covers creating and revoking them.
Scheduler
The background jobs, such as the GeoLite2 refresh, the server location refresh, the DROP lists refresh and the AbuseIPDB blacklist refresh, with their recent runs and next run. Run now starts a job straight away.
Logs
The app's own log in three tabs: System log, Login log, and Downloads for the raw log files. The system log updates live and filters by level, component and text.
Appearance
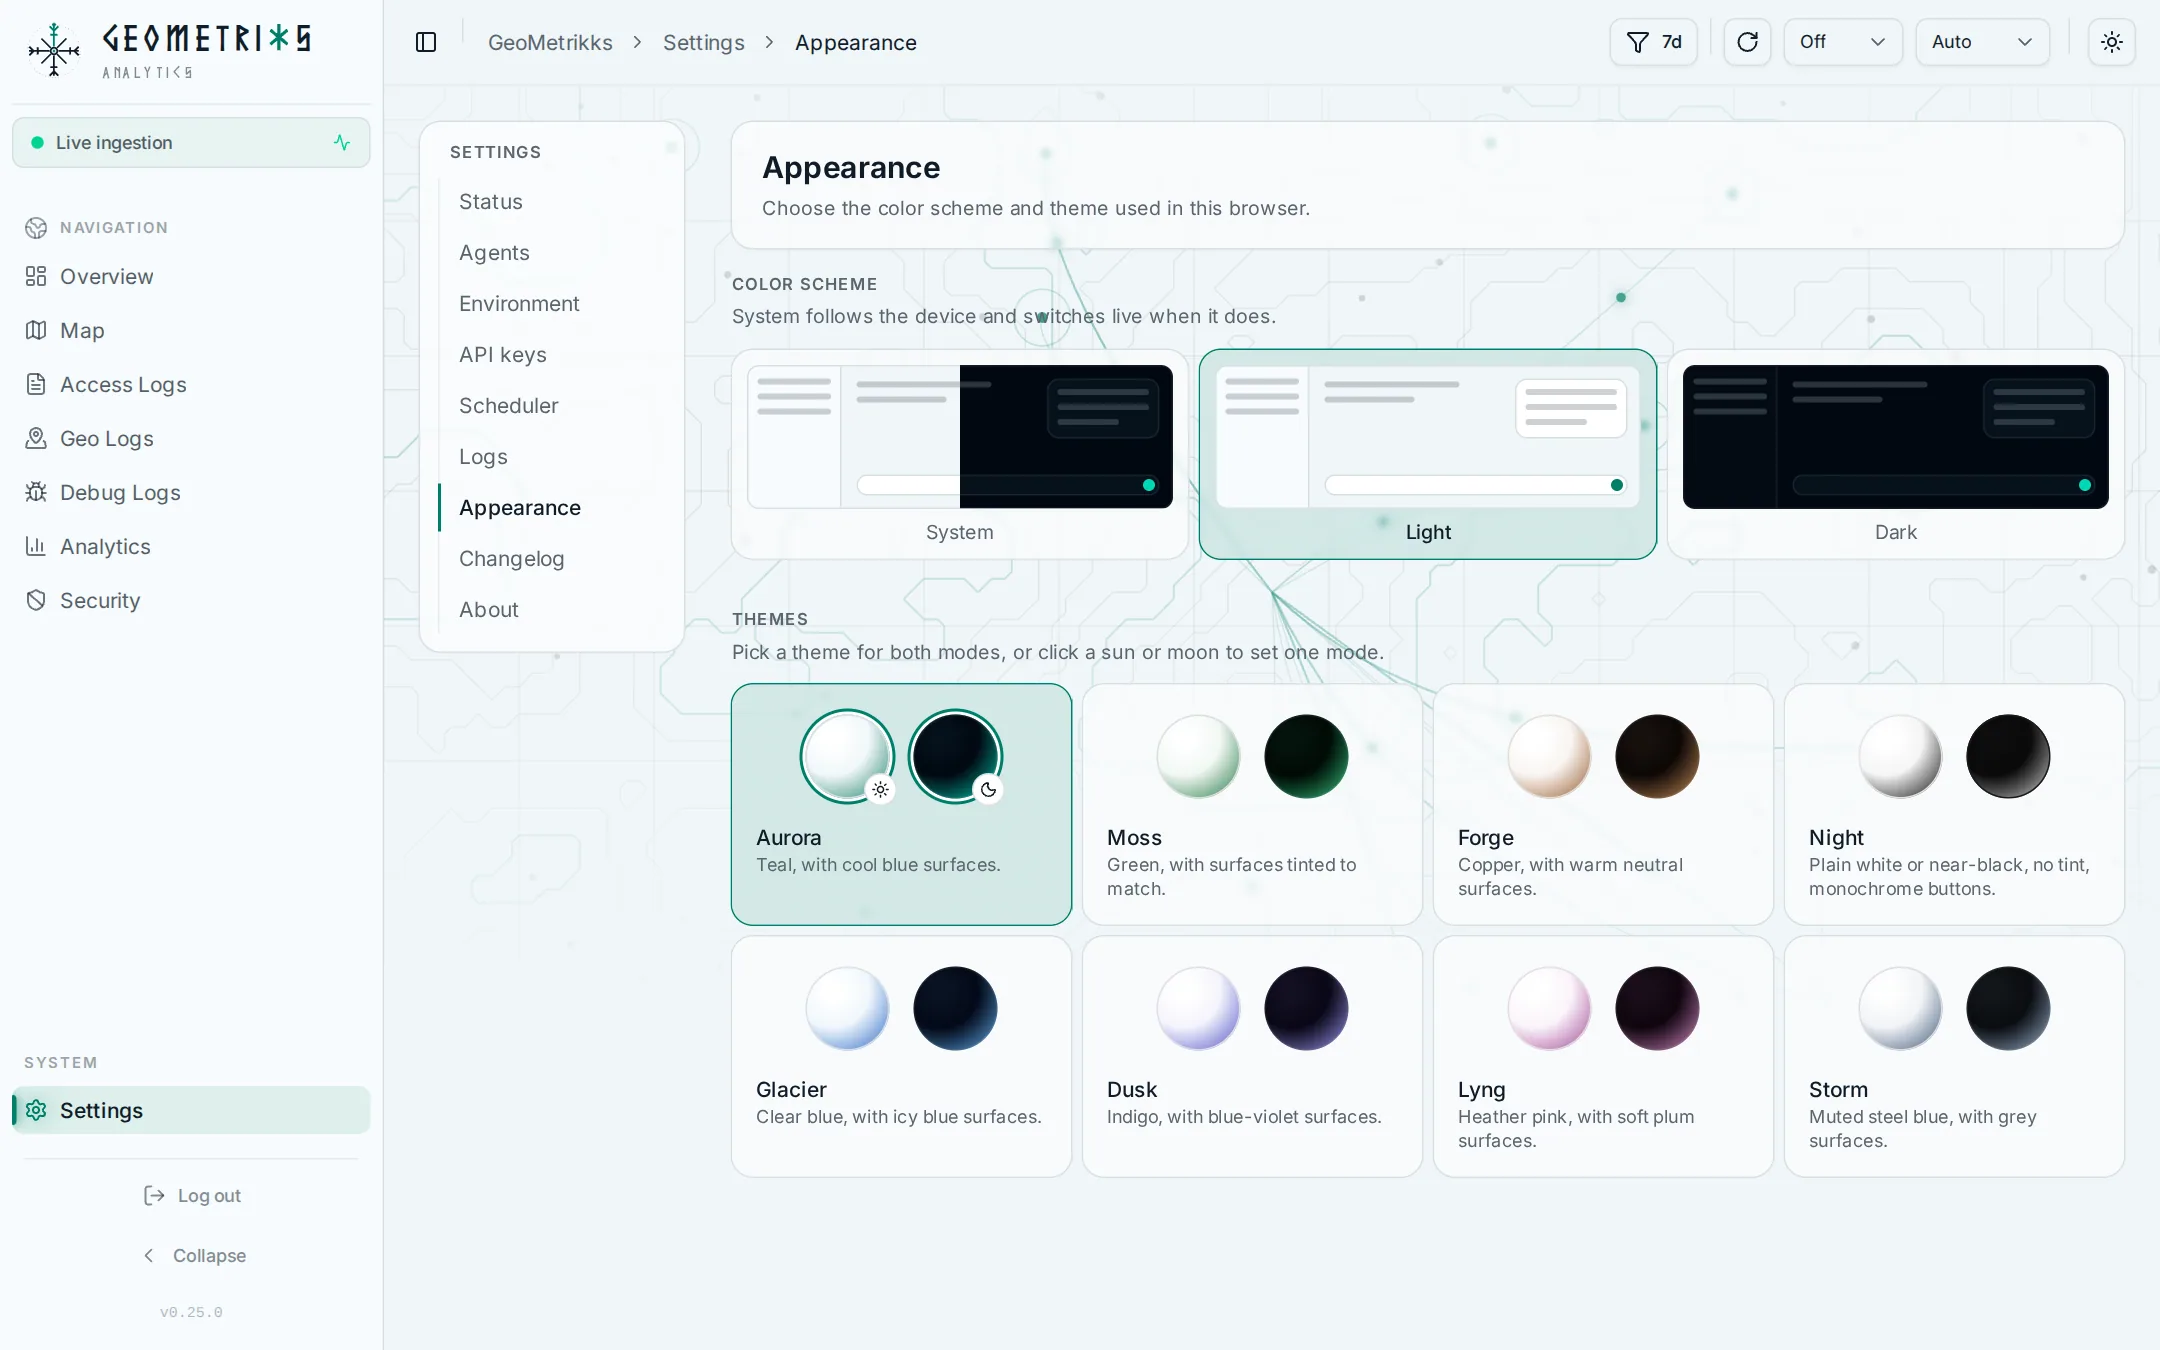
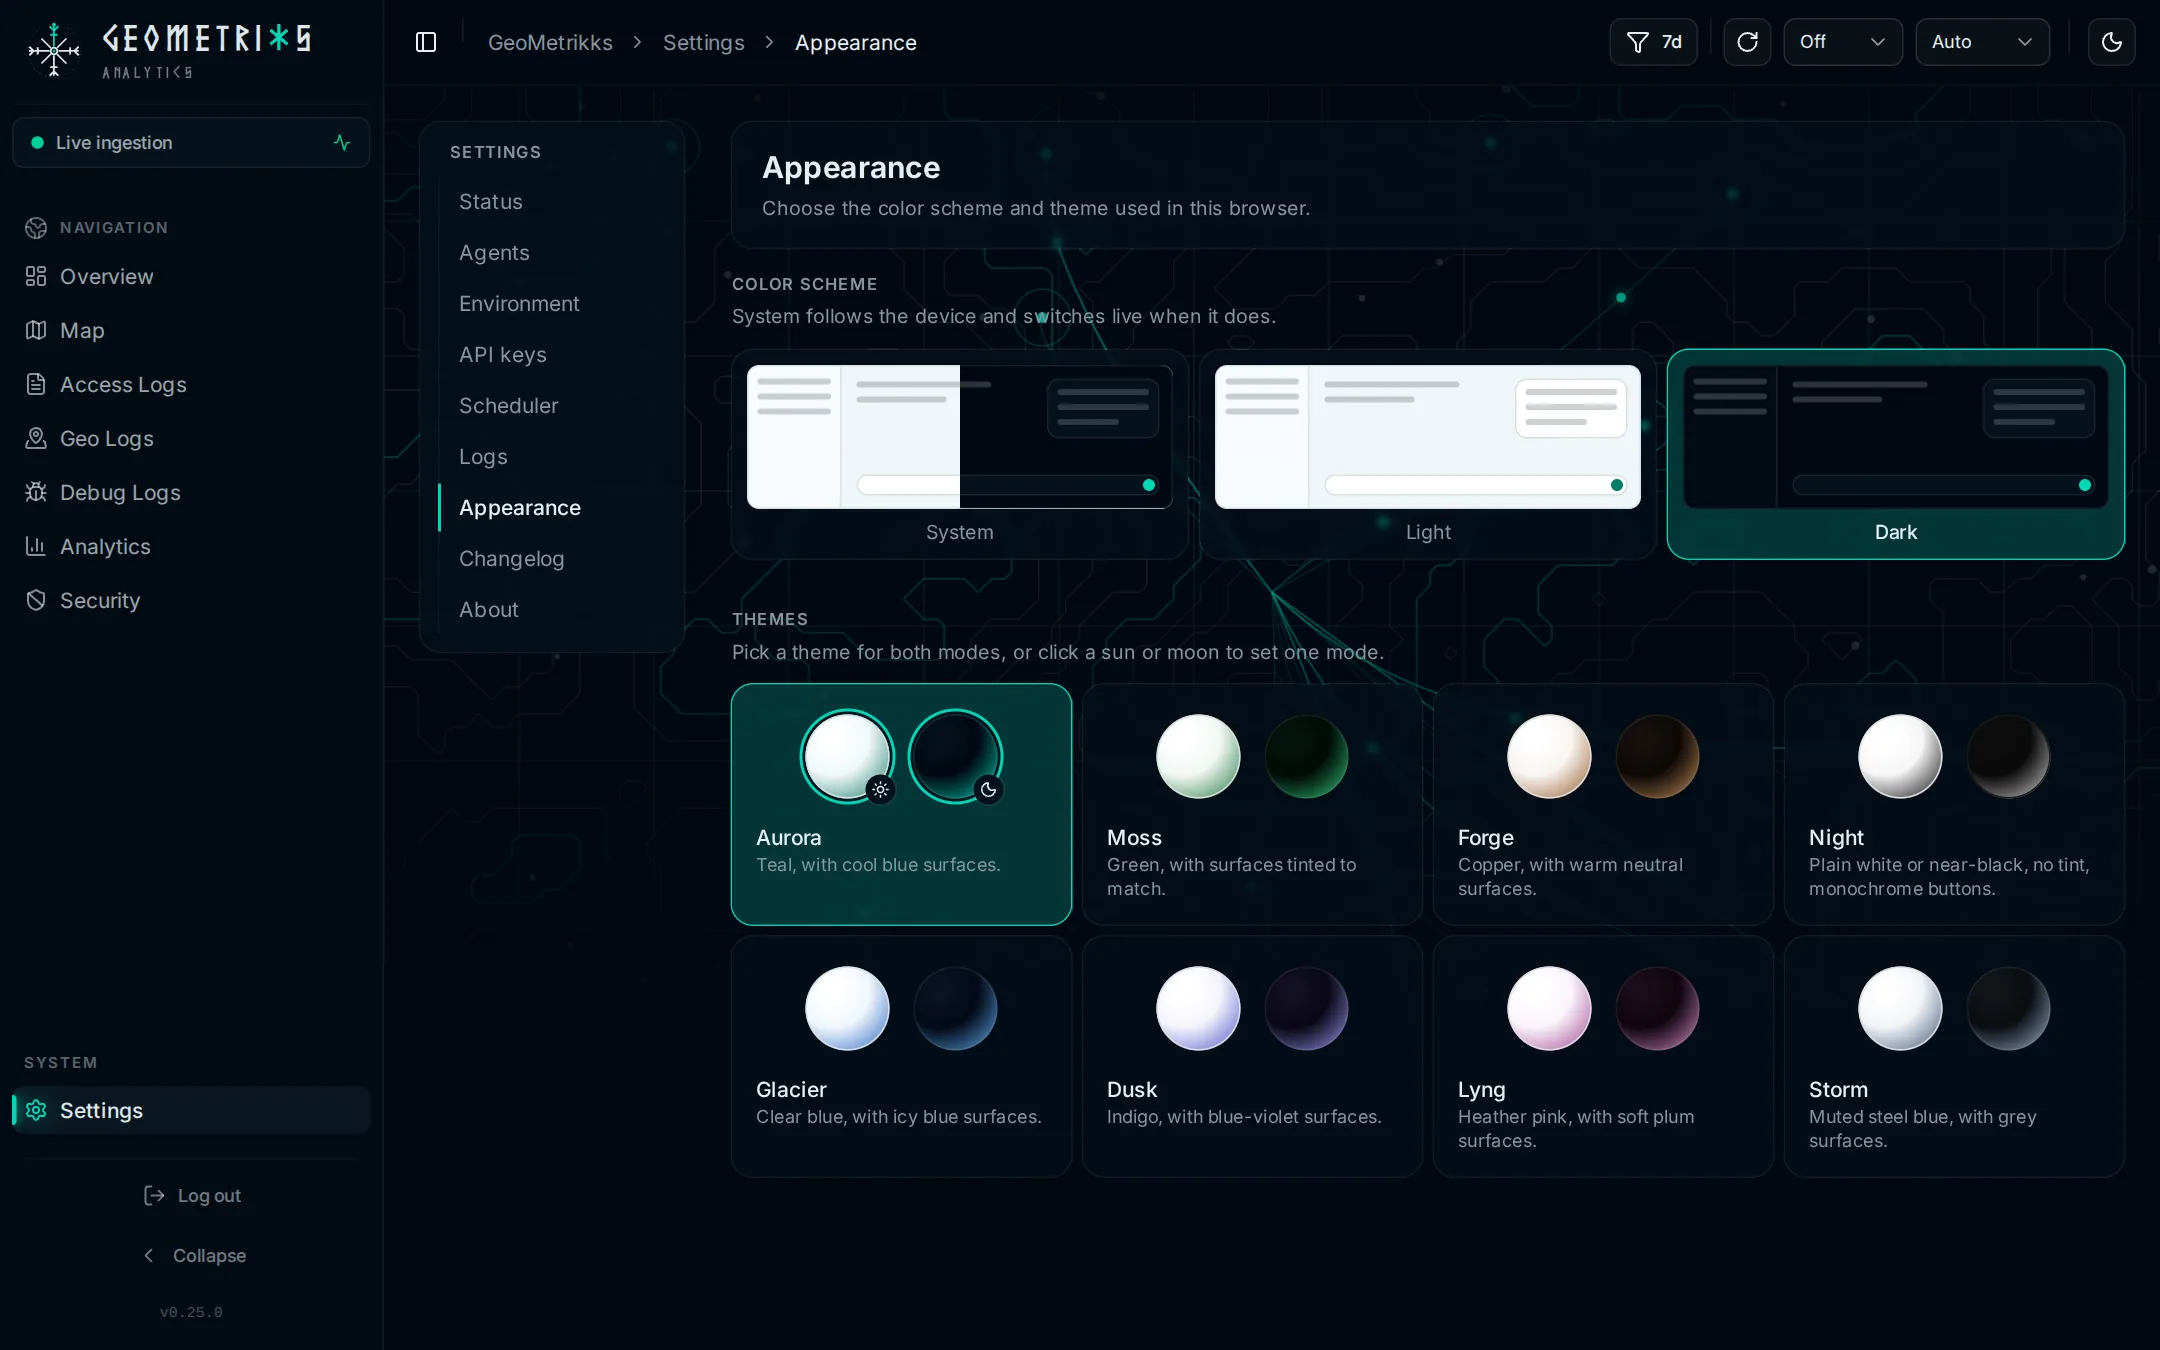
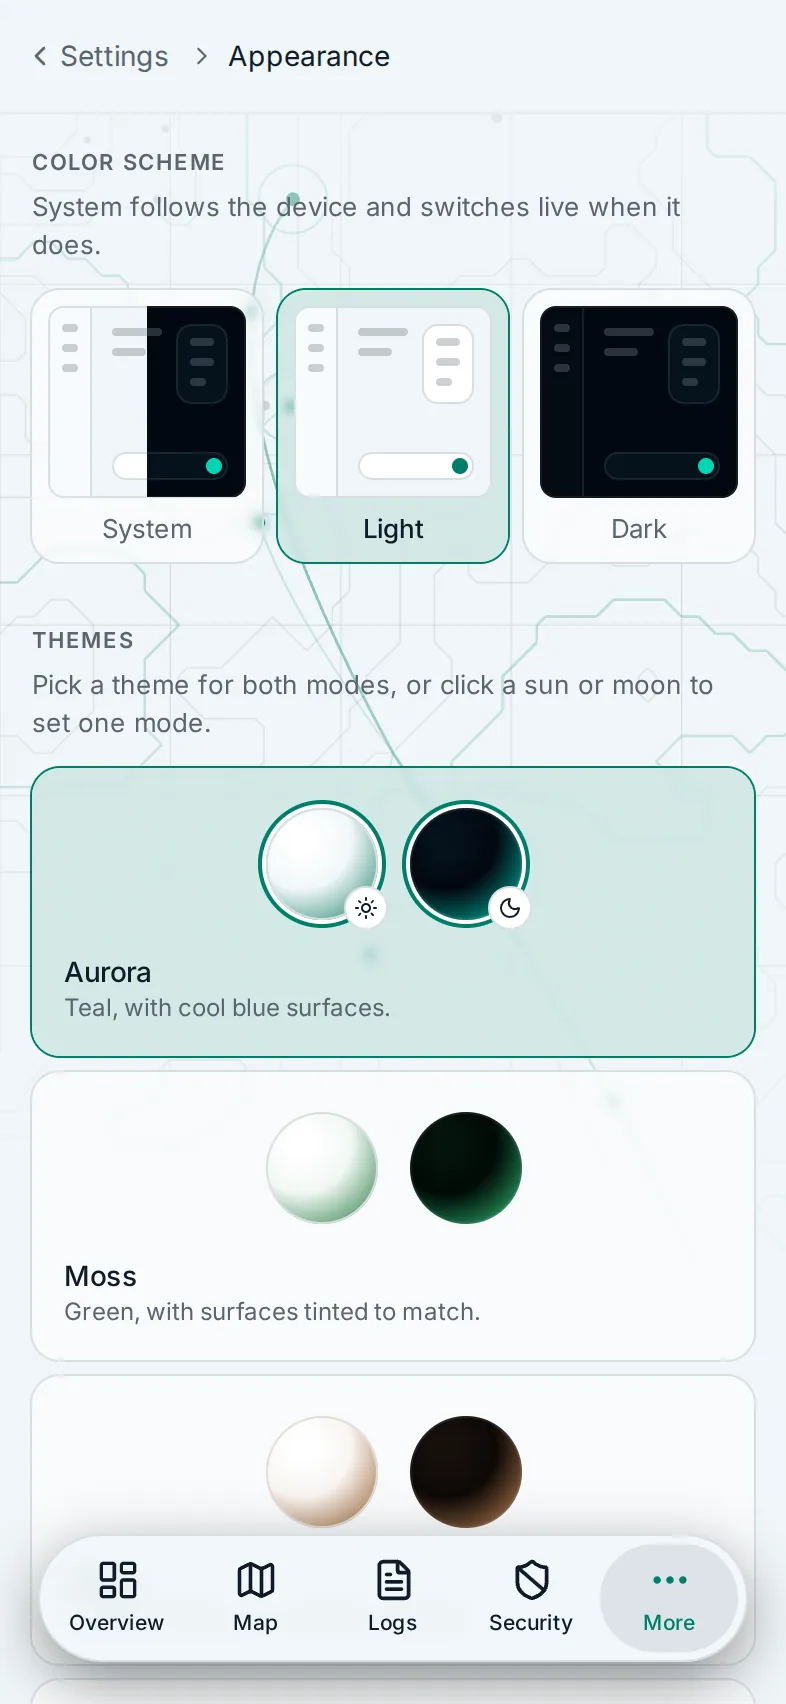
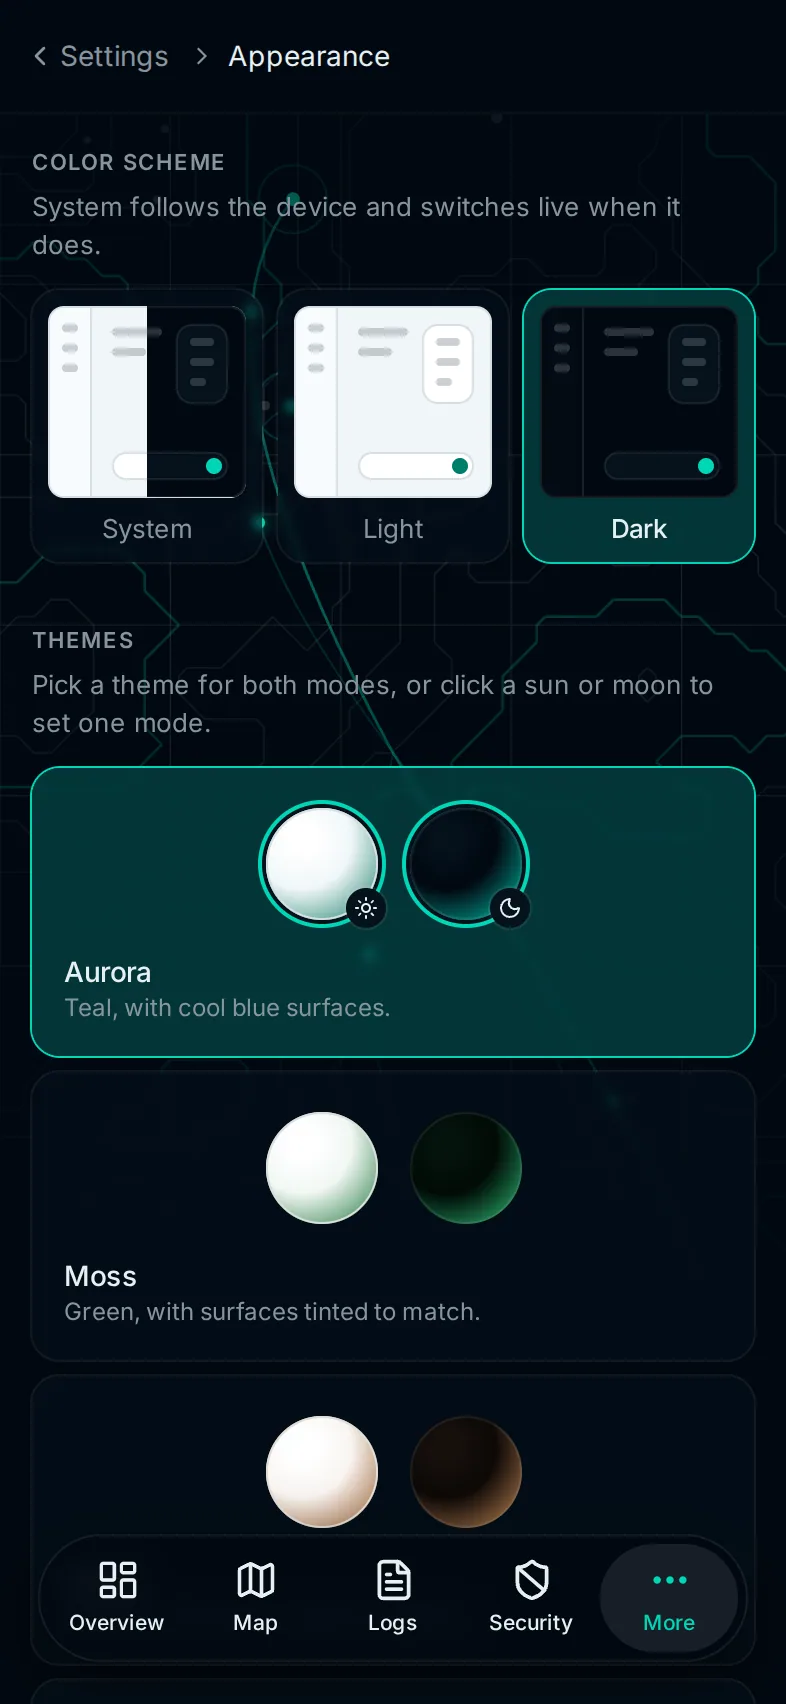
The color scheme and theme for this browser. There are eight themes, Aurora, Moss, Forge, Night, Glacier, Dusk, Lyng and Storm, each with a light and a dark palette.
Changelog
What changed in each release, and which one this install runs. A dot on the Changelog entry, and on Settings in the sidebar, marks changes you haven't read yet.
About
About shows the running version and its uptime, then the runtime, the database, the GeoIP databases with the hosting network list, and the DROP lists. With APP_UPDATE_CHECK=true, the default, the app asks GitHub every 12 hours whether a newer release exists. When one does, About shows it next to the running version. Until you open About, a dot sits next to the version number at the foot of the sidebar and on the About entry in Settings. Set APP_UPDATE_CHECK=false for an install that should not contact GitHub; the app then never shows a newer release.